
AGCO CORP /DE (AGCO) FY2026 YTD Q2 P&L / Income Statement
2026-01-01 to 2026-06-30
Revenue by Product and Service
2026-01-01 to 2026-06-30
Swipe to see the full flow
Chart details
AGCO CORP /DE (AGCO) FY2026 YTD Q2 P&L / Income Statement
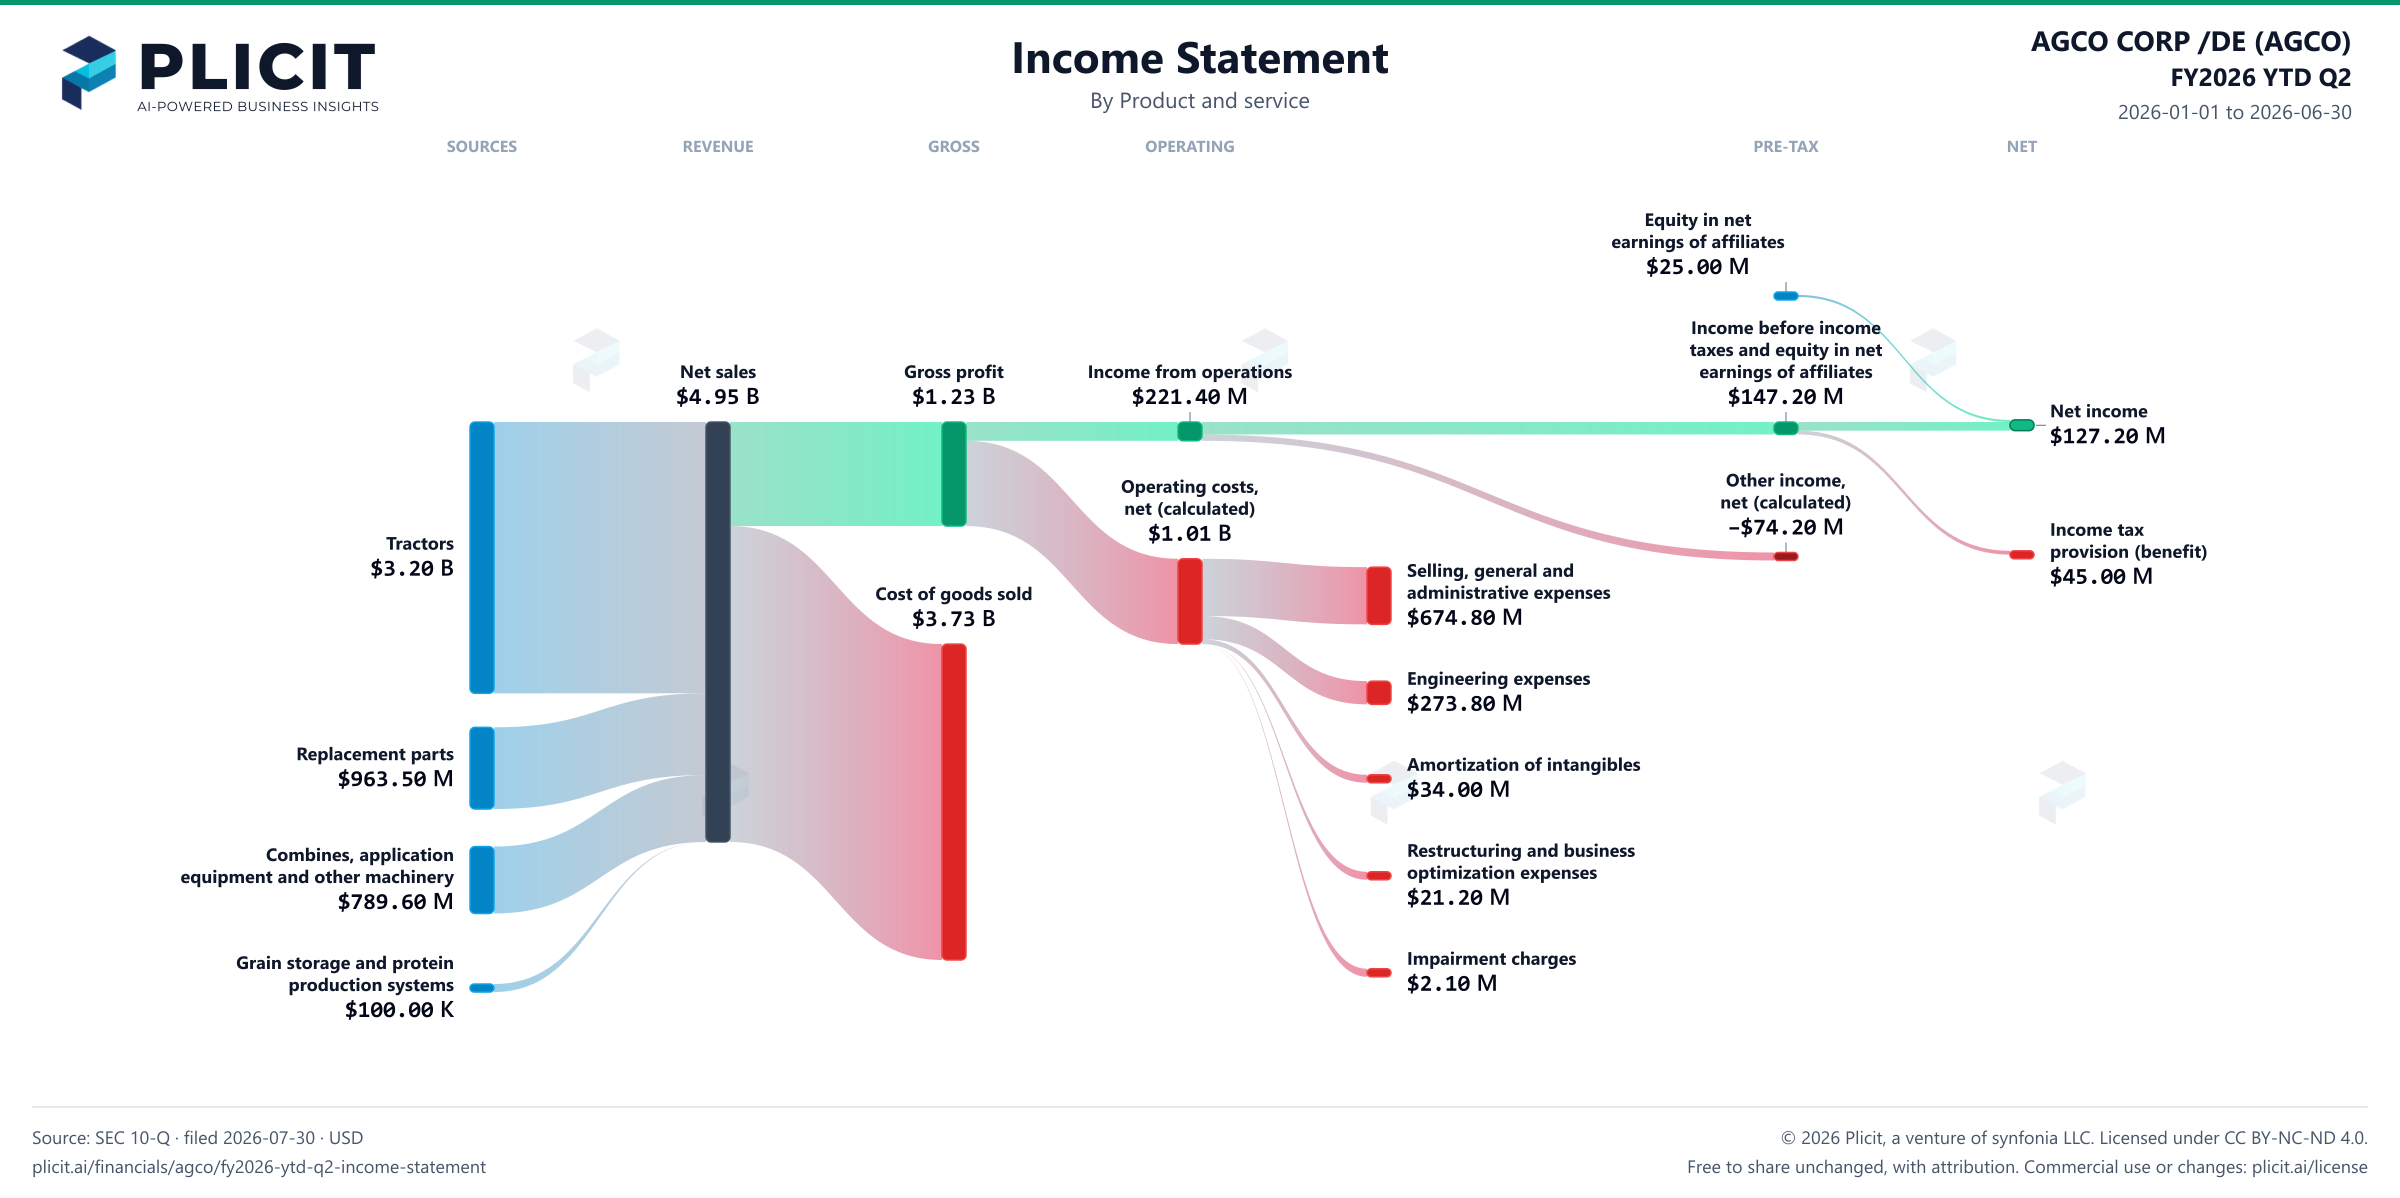
Income statement for 2026-01-01 through 2026-06-30. View: Product and service. Revenue uses this breakdown; costs and expenses retain the consolidated categories.
- Net sales
- 4,952,600,000 US dollars
- Cost of goods sold
- 3,725,300,000 US dollars
- Gross profit
- 1,227,300,000 US dollars
- Operating costs, net of other operating income (calculated)
- 1,005,900,000 US dollars
- Income from operations
- 221,400,000 US dollars
- Other income (expense), net (calculated)
- negative 74,200,000 US dollars
- Income before income taxes and equity in net earnings of affiliates
- 147,200,000 US dollars
- Income tax provision (benefit)
- 45,000,000 US dollars
- Net income
- 127,200,000 US dollars
- Tractors
- 3,199,400,000 US dollars
- Replacement parts
- 963,500,000 US dollars
- Grain storage and protein production systems
- 100,000 US dollars
- Combines, application equipment and other machinery
- 789,600,000 US dollars
- Selling, general and administrative expenses
- 674,800,000 US dollars
- Engineering expenses
- 273,800,000 US dollars
- Amortization of intangibles
- 34,000,000 US dollars
- Impairment charges
- 2,100,000 US dollars
- Restructuring and business optimization expenses
- 21,200,000 US dollars
- Loss on sale of business
- 0 US dollars
- Equity in net earnings of affiliates
- 25,000,000 US dollars. Reported below-tax contribution to net income.
Chart connections
- Revenue less cost of revenue equals gross profit; gross profit less operating expenses equals operating income.
- Operating income plus other income or expense equals income before tax. Income before tax less income tax expense or benefit, plus the explicitly reported below-tax contributions, equals net income.
- Of which attributable to AGCO CORP /DE: $132.20 M; to noncontrolling interests: −$5.00 M.
Free to share unchanged, with credit to Plicit.ai · CC BY-NC-ND 4.0Download PNG
Gross margin
24.8%
Gross profit / revenue
Operating margin
4.5%
Operating profit / revenue
Cash conversion
−192.6%
Operating cash / net income, same period
Product waitlist
Health Check and Teardown for your own company
A health check uncovers insights of your private books, not a public ticker. Join this list to get notified as soon as we go-live!