
Amgen Inc. (AMGN) FY2026 Q1 P&L / Income Statement
2026-01-01 to 2026-03-31
Revenue by Product and Service by Geography
2026-01-01 to 2026-03-31
Swipe to see the full flow
Chart details
Amgen Inc. (AMGN) FY2026 Q1 P&L / Income Statement
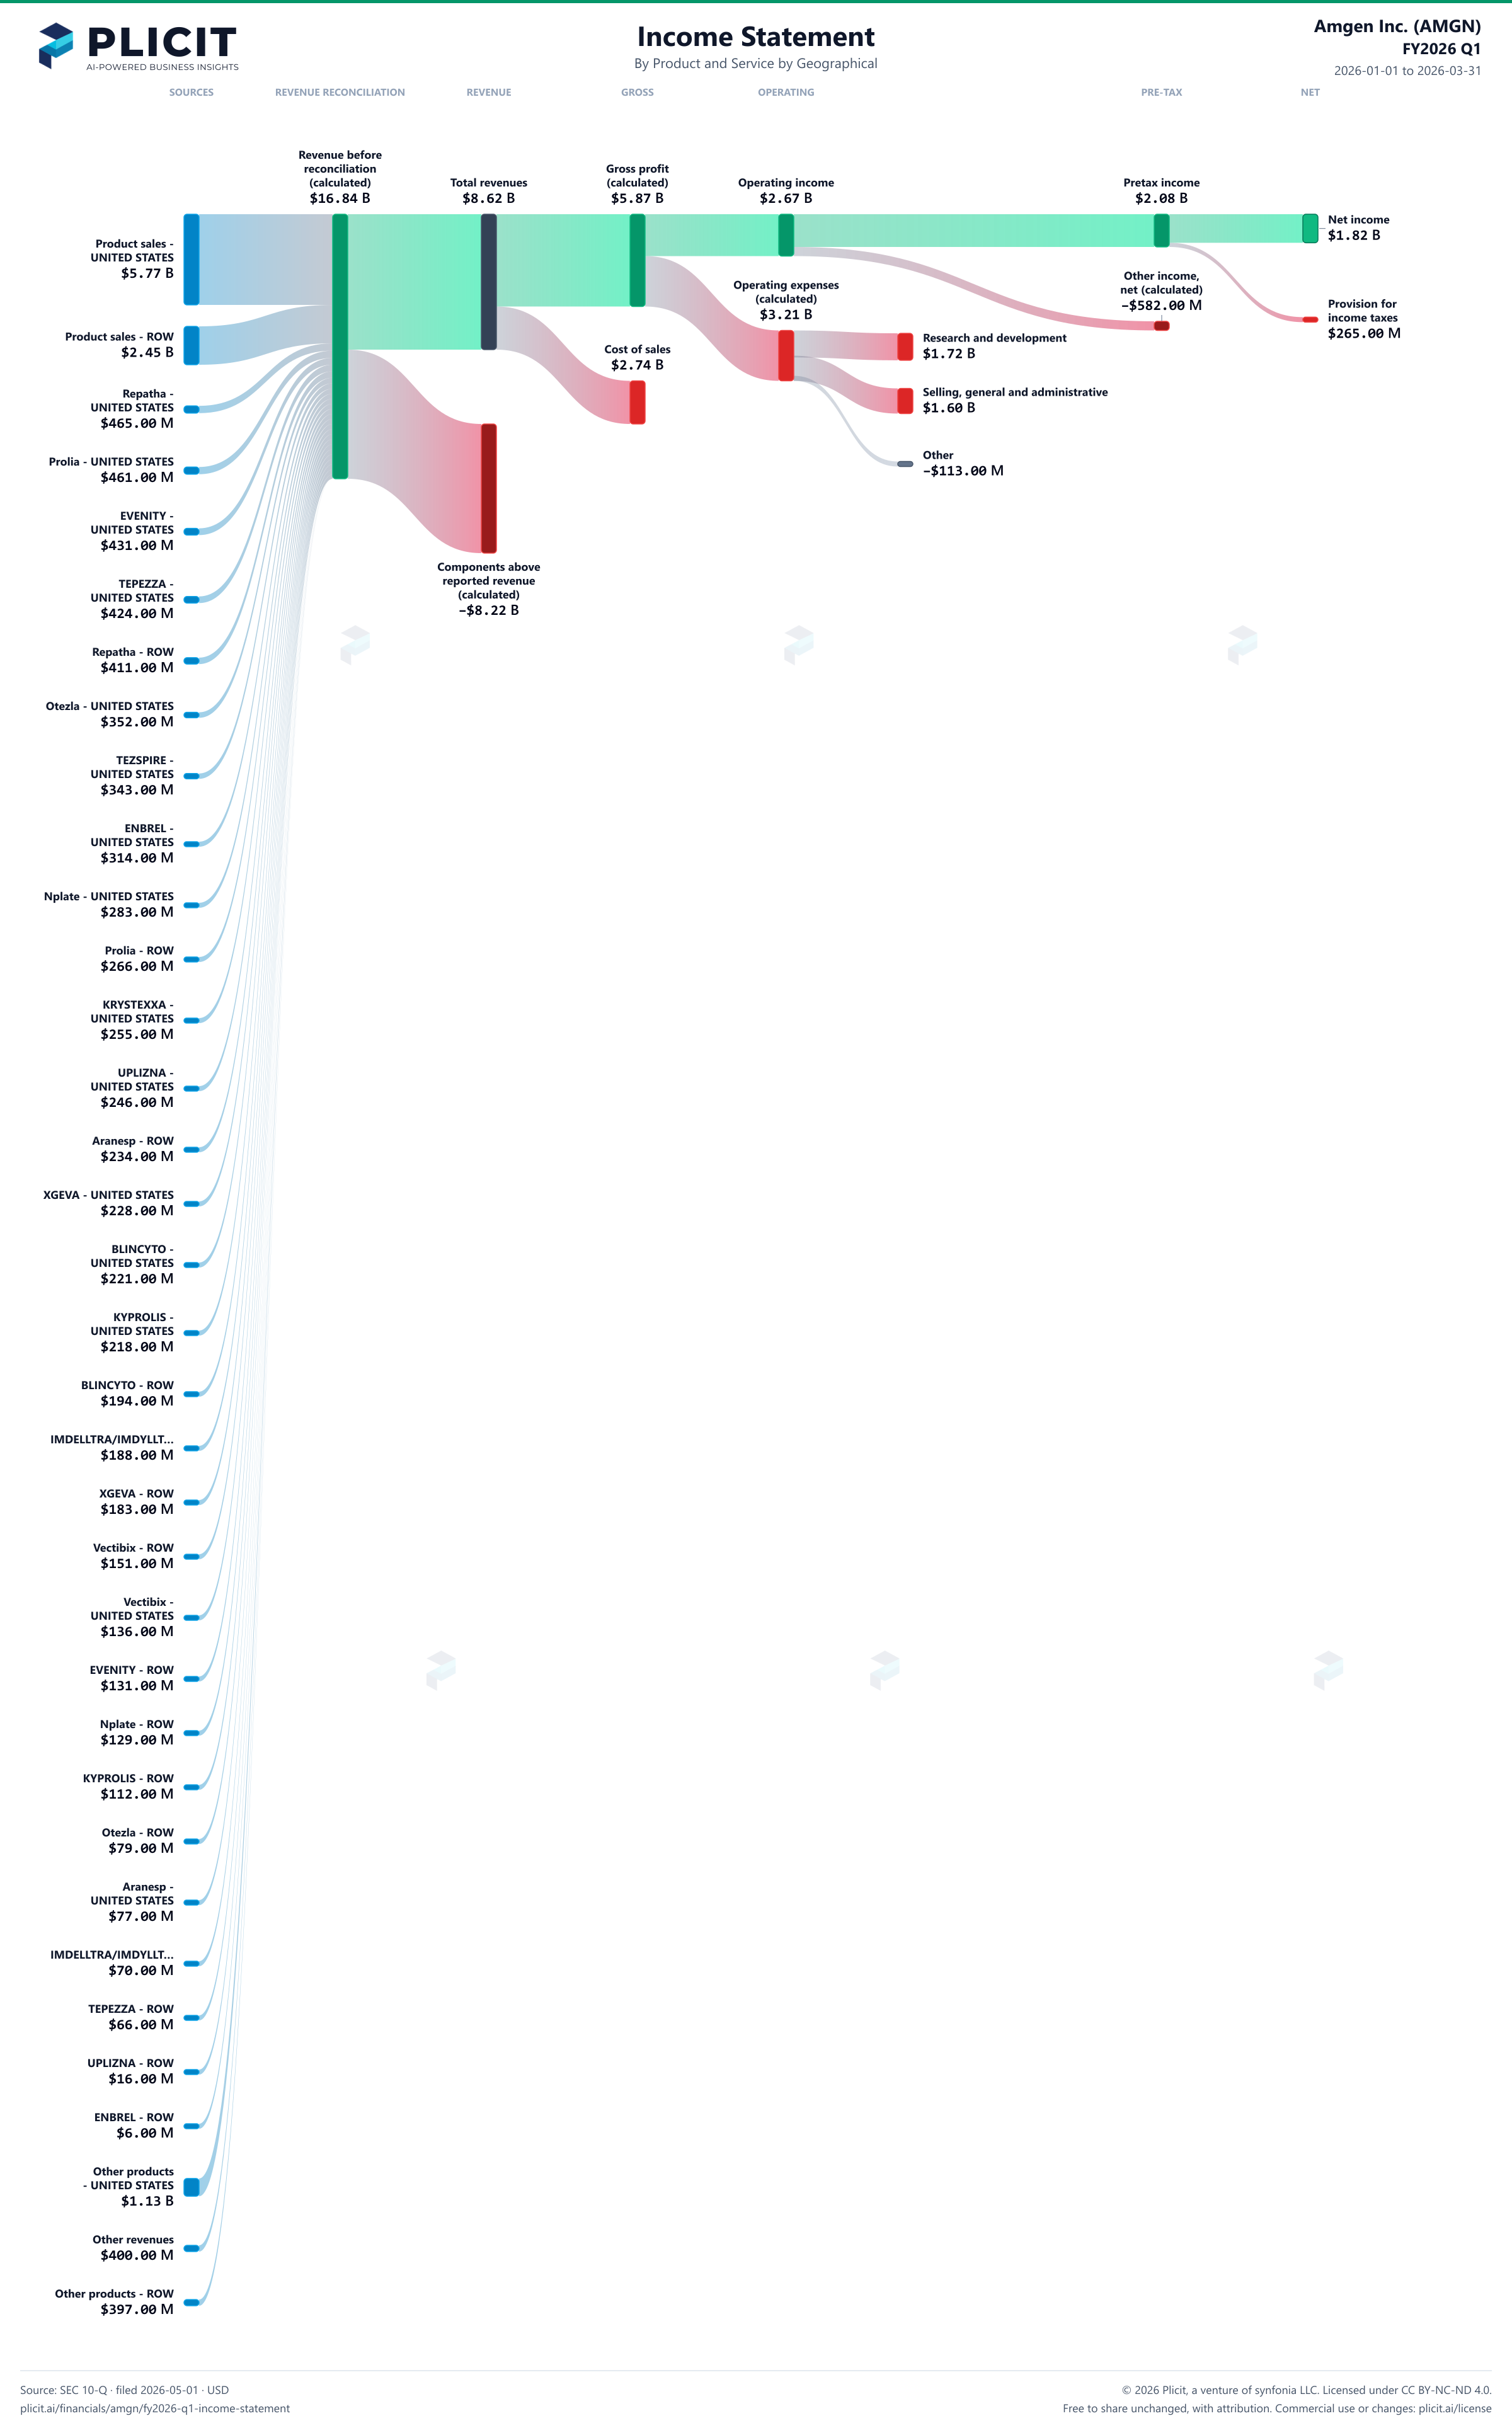
Income statement for 2026-01-01 through 2026-03-31. View: Product and Service by Geographical. Revenue uses this breakdown; costs and expenses retain the consolidated categories.
- Total revenues
- 8,618,000,000 US dollars
- Cost of sales
- 2,744,000,000 US dollars
- Gross profit (calculated)
- 5,874,000,000 US dollars
- Operating expenses (calculated)
- 3,208,000,000 US dollars
- Operating income
- 2,666,000,000 US dollars
- Other income (expense), net (calculated)
- negative 582,000,000 US dollars
- Income before income taxes
- 2,084,000,000 US dollars
- Provision for income taxes
- 265,000,000 US dollars
- Net income
- 1,819,000,000 US dollars
- Other revenues
- 400,000,000 US dollars
- Aranesp - UNITED STATES
- 77,000,000 US dollars
- Aranesp - Non-US
- 234,000,000 US dollars
- BLINCYTO - UNITED STATES
- 221,000,000 US dollars
- BLINCYTO - Non-US
- 194,000,000 US dollars
- EVENITY - UNITED STATES
- 431,000,000 US dollars
- EVENITY - Non-US
- 131,000,000 US dollars
- ENBREL - UNITED STATES
- 314,000,000 US dollars
- ENBREL - Non-US
- 6,000,000 US dollars
- IMDELLTRA/IMDYLLTRA - UNITED STATES
- 188,000,000 US dollars
- IMDELLTRA/IMDYLLTRA - Non-US
- 70,000,000 US dollars
- KRYSTEXXA - UNITED STATES
- 255,000,000 US dollars
- KRYSTEXXA - Non-US
- 0 US dollars
- Kyprolis - UNITED STATES
- 218,000,000 US dollars
- Kyprolis - Non-US
- 112,000,000 US dollars
- Nplate - UNITED STATES
- 283,000,000 US dollars
- Nplate - Non-US
- 129,000,000 US dollars
- Otezla - UNITED STATES
- 352,000,000 US dollars
- Otezla - Non-US
- 79,000,000 US dollars
- Other products - UNITED STATES
- 1,131,000,000 US dollars
- Other products - Non-US
- 397,000,000 US dollars
- Prolia - UNITED STATES
- 461,000,000 US dollars
- Prolia - Non-US
- 266,000,000 US dollars
- Repatha - UNITED STATES
- 465,000,000 US dollars
- Repatha - Non-US
- 411,000,000 US dollars
- TEPEZZA - UNITED STATES
- 424,000,000 US dollars
- TEPEZZA - Non-US
- 66,000,000 US dollars
- TEZSPIRE - UNITED STATES
- 343,000,000 US dollars
- TEZSPIRE - Non-US
- 0 US dollars
- UPLIZNA - UNITED STATES
- 246,000,000 US dollars
- UPLIZNA - Non-US
- 16,000,000 US dollars
- Vectibix - UNITED STATES
- 136,000,000 US dollars
- Vectibix - Non-US
- 151,000,000 US dollars
- XGEVA - UNITED STATES
- 228,000,000 US dollars
- XGEVA - Non-US
- 183,000,000 US dollars
- Product sales - UNITED STATES
- 5,773,000,000 US dollars
- Product sales - Non-US
- 2,445,000,000 US dollars
- Selling, general and administrative
- 1,602,000,000 US dollars
- Research and development
- 1,719,000,000 US dollars
- Other
- negative 113,000,000 US dollars
- Revenue before reconciliation (calculated)
- 16,836,000,000 US dollars. Sum of the reported revenue categories before the separately reported reconciliation.
- Components above reported revenue (calculated)
- negative 8,218,000,000 US dollars. The disclosed components add up to more than reported revenue; this is the difference, calculated, not a reported item.
Chart connections
- Revenue less cost of revenue equals gross profit; gross profit less operating expenses equals operating income.
- Operating income plus other income or expense equals income before tax. Income before tax less income tax expense or benefit equals net income.
- Reported revenue categories plus the separately reported signed reconciliation equals consolidated revenue.
Free to share unchanged, with credit to Plicit.ai · CC BY-NC-ND 4.0Download PNG
Gross margin
68.2%
Gross profit / revenue
Operating margin
30.9%
Operating profit / revenue
Cash conversion
120.3%
Operating cash / net income, same period
Product waitlist
Health Check and Teardown for your own company
A health check uncovers insights of your private books, not a public ticker. Join this list to get notified as soon as we go-live!