
AMAZON.COM, INC. (AMZN) FY2026 Q2 P&L / Income Statement
2026-04-01 to 2026-06-30
Revenue by Product and Service (7 categories)
2026-04-01 to 2026-06-30
Swipe to see the full flow
Chart details
AMAZON.COM, INC. (AMZN) FY2026 Q2 P&L / Income Statement
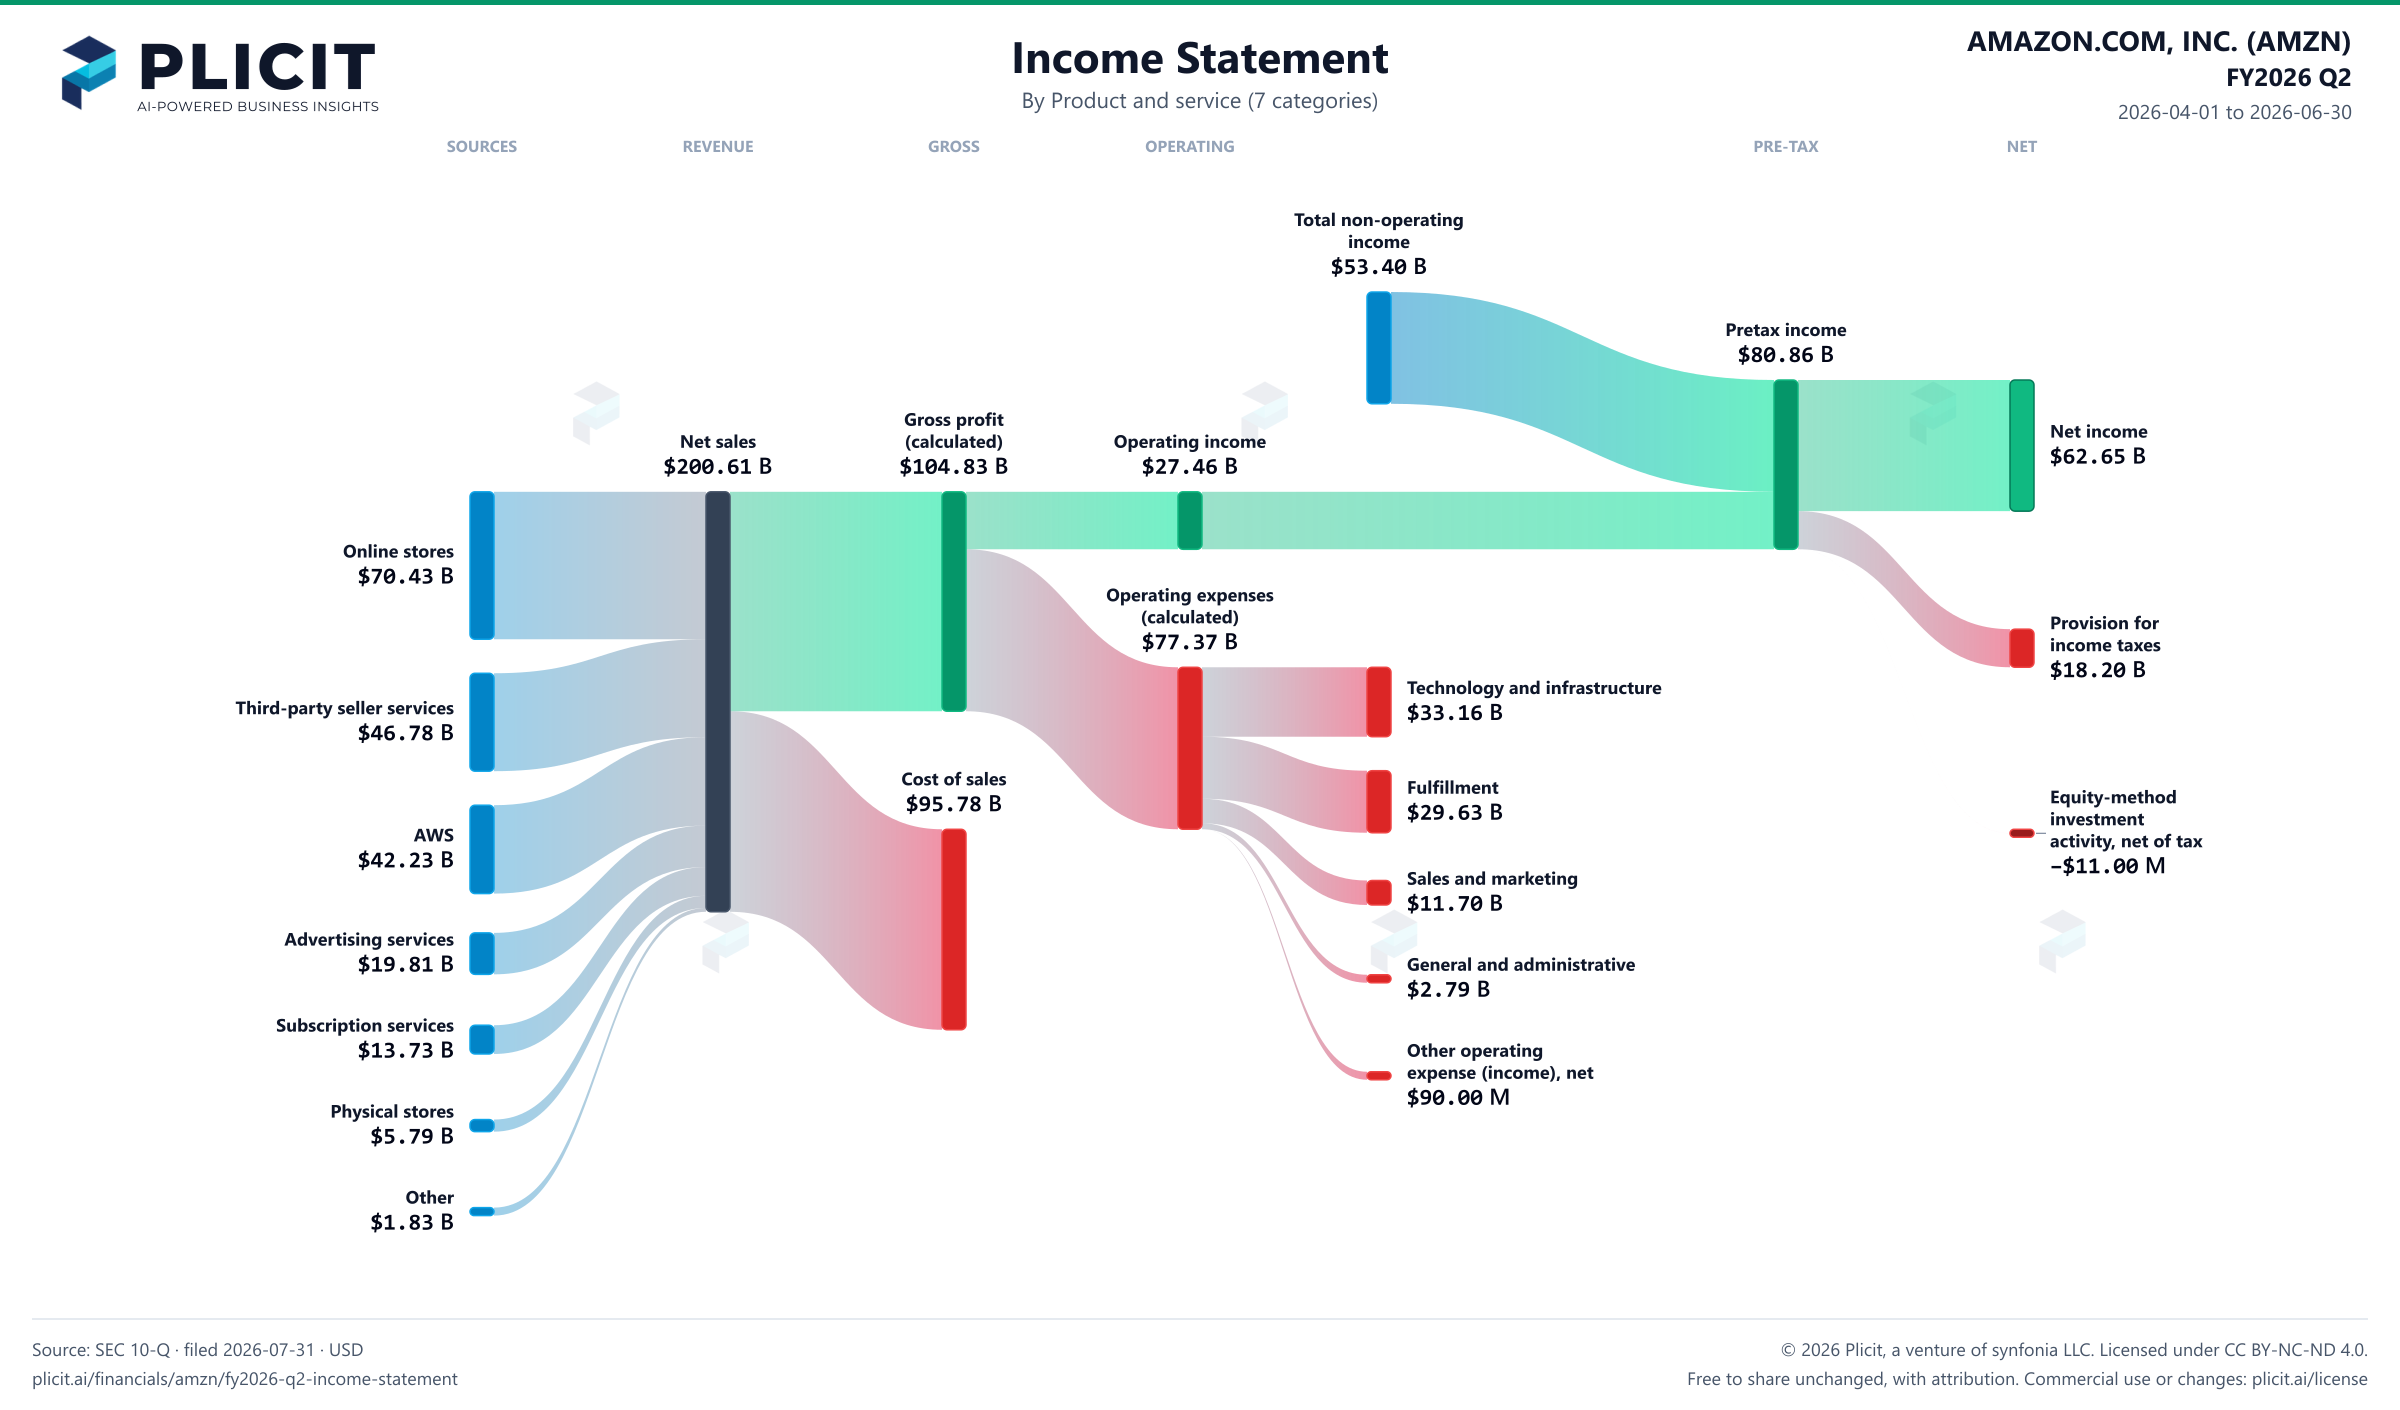
Income statement for 2026-04-01 through 2026-06-30. View: Product and service (7 categories). Revenue uses this breakdown; costs and expenses retain the consolidated categories.
- Net sales
- 200,606,000,000 US dollars
- Cost of sales
- 95,778,000,000 US dollars
- Gross profit (calculated)
- 104,828,000,000 US dollars
- Operating expenses (calculated)
- 77,367,000,000 US dollars
- Operating income
- 27,461,000,000 US dollars
- Total non-operating income
- 53,396,000,000 US dollars
- Income before income taxes
- 80,857,000,000 US dollars
- Provision for income taxes
- 18,199,000,000 US dollars
- Net income
- 62,647,000,000 US dollars
- Online stores
- 70,432,000,000 US dollars
- Physical stores
- 5,794,000,000 US dollars
- Third-party seller services
- 46,780,000,000 US dollars
- Advertising services
- 19,809,000,000 US dollars
- Subscription services
- 13,730,000,000 US dollars
- Amazon Web Services
- 42,232,000,000 US dollars
- Other
- 1,829,000,000 US dollars
- Fulfillment
- 29,633,000,000 US dollars
- Sales and marketing
- 11,698,000,000 US dollars
- Technology and infrastructure
- 33,158,000,000 US dollars
- General and administrative
- 2,788,000,000 US dollars
- Other operating expense (income), net
- 90,000,000 US dollars
- Equity-method investment activity, net of tax
- negative 11,000,000 US dollars. Reported below-tax contribution to net income.
Chart connections
- Revenue less cost of revenue equals gross profit; gross profit less operating expenses equals operating income.
- Operating income plus other income or expense equals income before tax. Income before tax less income tax expense or benefit, plus the explicitly reported below-tax contributions, equals net income.
Free to share unchanged, with credit to Plicit.ai · CC BY-NC-ND 4.0Download PNG
Gross margin
52.3%
Gross profit / revenue
Operating margin
13.7%
Operating profit / revenue
Cash conversion
72.4%
Operating cash / net income, same period
Product waitlist
Health Check and Teardown for your own company
A health check uncovers insights of your private books, not a public ticker. Join this list to get notified as soon as we go-live!