
ARMSTRONG WORLD INDUSTRIES, INC. (AWI) FY2026 YTD Q2 P&L / Income Statement

Revenue by Business Segment by Customer

2026-01-01 to 2026-06-30

Swipe to see the full flow
ARMSTRONG WORLD INDUSTRIES, INC. (AWI) FY2026 YTD Q2 P&L / Income StatementIncome statement for 2026-01-01 through 2026-06-30. View: Business segment by customer. Revenue uses this breakdown; costs and expenses retain the consolidated categories.SOURCESREVENUEGROSSOPERATINGPRE-TAXNETMineral Fiber - DistributorsArchitectural Specialties - Direct CustomersArchitectural Specialties - DistributorsMineral Fiber - Home CentersMineral Fiber - OtherMineral Fiber - Direct CustomersArchitectural Specialties - OtherNet salesGross profitCost of goods soldOperating incomeOperating costs, net of other operating income (calculated)Selling, general and administrative expensesEquity (earnings) from unconsolidated affiliates, netLoss related to change in fair value of contingent consideration, netEarnings before income taxesOther income (expense), net (calculated)Net earningsIncome tax expenseEarnings before income taxesEarnings beforeincome taxes$215.30 MNet salesNet sales$881.90 MGross profitGross profit$350.30 MOperating incomeOperating income$228.00 MNet earningsNet earnings$163.50 MMineral Fiber - DistributorsMineral Fiber - Distributors$406.20 MOperating costs, net of other operating income (calculated)Operating costs,net (calculated)$122.30 MIncome tax expenseIncome tax expense$51.80 MCost of goods soldCost of goods sold$531.60 MArchitectural Specialties - Direct CustomersArchitectural Specialties- Direct Customers$177.00 MSelling, general and administrative expensesSelling, general andadministrative expenses$182.10 MOther income (expense), net (calculated)Other income,net (calculated)−$12.70 MEquity (earnings) from unconsolidated affiliates, netEquity (earnings) fromunconsolidated affiliates, net−$60.70 MArchitectural Specialties - DistributorsArchitectural Specialties- Distributors$147.00 MMineral Fiber - Home CentersMineral Fiber - Home Centers$57.50 MLoss related to change in fair value of contingent consideration, netLoss related to change in fair valueof contingent consideration, net$900.00 KMineral Fiber - OtherMineral Fiber - Other$50.90 MMineral Fiber - Direct CustomersMineral Fiber - Direct Customers$30.80 MArchitectural Specialties - OtherArchitectural Specialties - Other$12.50 M
Chart details

ARMSTRONG WORLD INDUSTRIES, INC. (AWI) FY2026 YTD Q2 P&L / Income Statement

Income statement for 2026-01-01 through 2026-06-30. View: Business segment by customer. Revenue uses this breakdown; costs and expenses retain the consolidated categories.

Net sales
881,900,000 US dollars
Cost of goods sold
531,600,000 US dollars
Gross profit
350,300,000 US dollars
Operating costs, net of other operating income (calculated)
122,300,000 US dollars
Operating income
228,000,000 US dollars
Other income (expense), net (calculated)
negative 12,700,000 US dollars
Earnings before income taxes
215,300,000 US dollars
Income tax expense
51,800,000 US dollars
Net earnings
163,500,000 US dollars
Architectural Specialties - Direct Customers
177,000,000 US dollars
Architectural Specialties - Distributors
147,000,000 US dollars
Architectural Specialties - Other
12,500,000 US dollars
Mineral Fiber - Direct Customers
30,800,000 US dollars
Mineral Fiber - Distributors
406,200,000 US dollars
Mineral Fiber - Home Centers
57,500,000 US dollars
Mineral Fiber - Other
50,900,000 US dollars
Unallocated Corporate
0 US dollars
Loss related to change in fair value of contingent consideration, net
900,000 US dollars
Selling, general and administrative expenses
182,100,000 US dollars
Equity (earnings) from unconsolidated affiliates, net
negative 60,700,000 US dollars

Chart connections

  • Revenue less cost of revenue equals gross profit; gross profit less operating expenses equals operating income.
  • Operating income plus other income or expense equals income before tax. Income before tax less income tax expense or benefit equals net income.
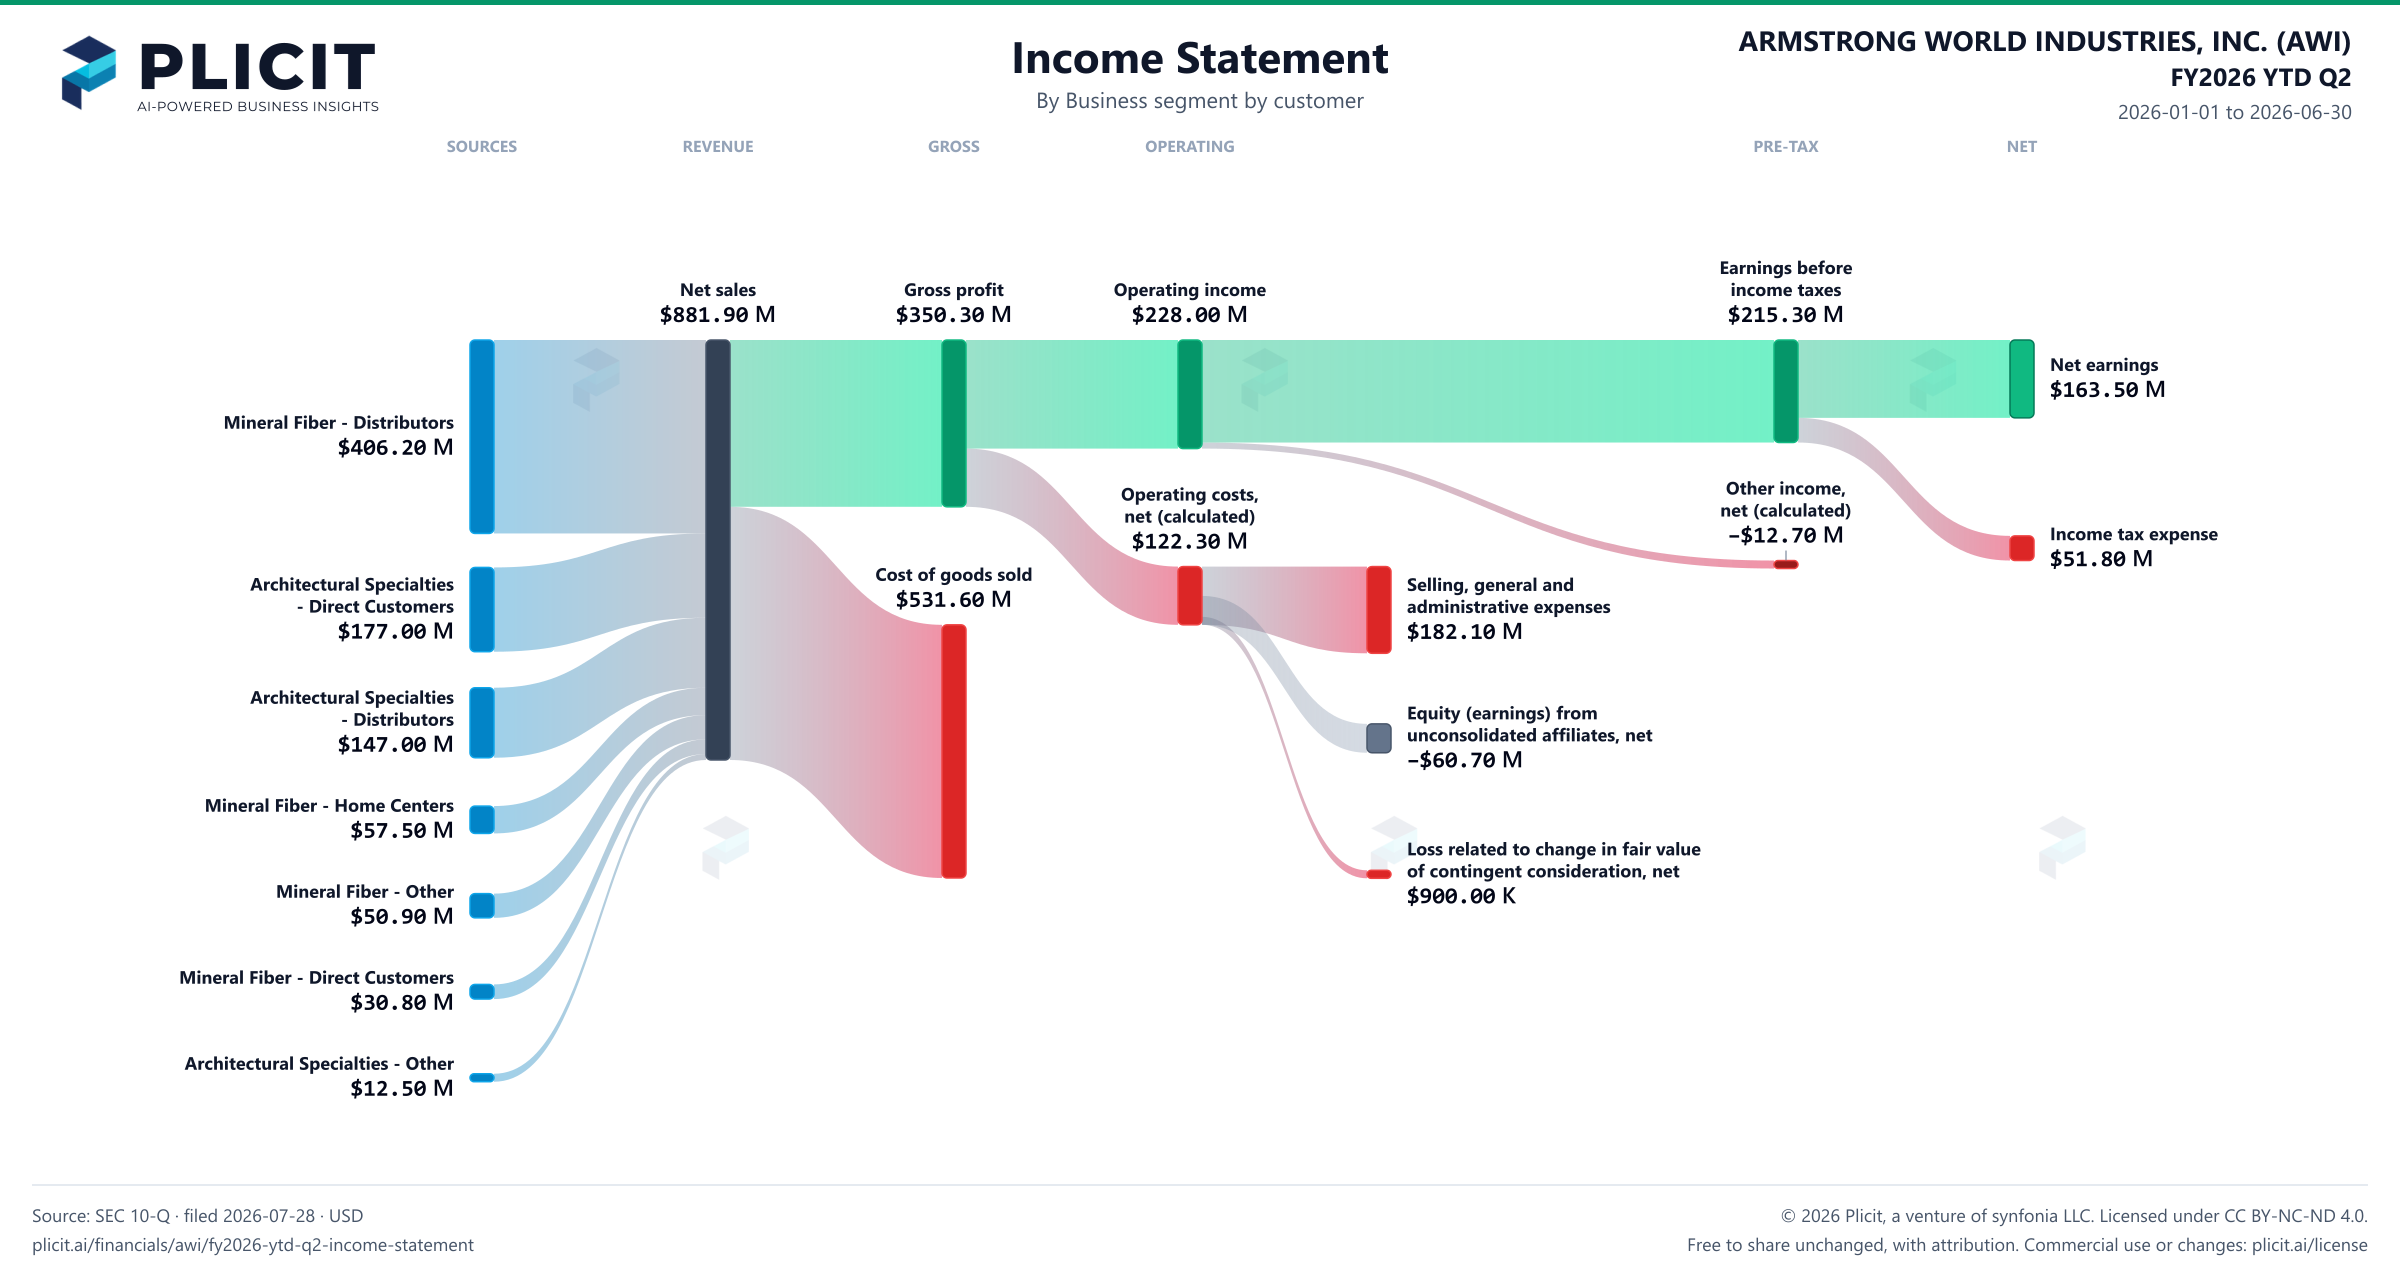
ARMSTRONG WORLD INDUSTRIES, INC. (AWI) FY2026 YTD Q2 Revenue by Business Segment by Customer Sankey chart
Free to share unchanged, with credit to Plicit.ai · CC BY-NC-ND 4.0Download PNG

Gross margin

39.7%

Gross profit / revenue

Operating margin

25.9%

Operating profit / revenue

Cash conversion

77.0%

Operating cash / net income, same period

Newsletter

Get the teardowns by email

Subscribe if you want the public-company teardowns in your inbox when they're released.

Product waitlist

Health Check and Teardown for your own company

A health check uncovers insights of your private books, not a public ticker. Join this list to get notified as soon as we go-live!