
The Chemours Company (CC) FY2026 Q2 P&L / Income Statement

Revenue by Business Segment by Timing of Transfer

2026-04-01 to 2026-06-30

Swipe to see the full flow
The Chemours Company (CC) FY2026 Q2 P&L / Income StatementIncome statement for 2026-04-01 through 2026-06-30. View: Statement Business Segments by Timing Of Transfer Of Good Or Service. Revenue uses this breakdown; costs and expenses retain the consolidated categories.SOURCESREVENUEGROSSOPERATINGPRE-TAXNETTitanium Technologies - Transferred at a Point in TimeThermal & Specialized Solutions - Transferred at a Point in TimeAdvanced Performance Materials - Transferred at a Point in TimeOther Non-Reportable Segment - Transferred at a Point in TimeNet salesGross profitCost of goods soldOperating profit (calculated)Total other operating expensesSelling, general, and administrative expenseResearch and development expenseRestructuring, asset-related, and other chargesOther income (expense), net (calculated)Loss before income taxesNet lossProvision for income taxesOther income (expense), net (calculated)Other income,net (calculated)$212.00 MOperating profit (calculated)Operating profit(calculated)−$213.00 MLoss before income taxesLoss beforeincome taxes−$1.00 MNet salesNet sales$1.59 BGross profitGross profit$286.00 MNet lossNet loss−$274.00 MTitanium Technologies - Transferred at a Point in TimeTitanium Technologies -Transferred at a Point in Time$661.00 MTotal other operating expensesTotal otheroperating expenses$499.00 MCost of goods soldCost of goods sold$1.31 BProvision for income taxesProvision forincome taxes$273.00 MSelling, general, and administrative expenseSelling, general, andadministrative expense$469.00 MThermal & Specialized Solutions - Transferred at a Point in TimeThermal & Specialized Solutions- Transferred at a Point in Time$591.00 MResearch and development expenseResearch anddevelopment expense$27.00 MAdvanced Performance Materials - Transferred at a Point in TimeAdvanced Performance Materials- Transferred at a Point in Time$326.00 MRestructuring, asset-related, and other chargesRestructuring, asset-related,and other charges$3.00 MOther Non-Reportable Segment - Transferred at a Point in TimeOther Non-Reportable Segment- Transferred at a Point in Time$13.00 M
Chart details

The Chemours Company (CC) FY2026 Q2 P&L / Income Statement

Income statement for 2026-04-01 through 2026-06-30. View: Statement Business Segments by Timing Of Transfer Of Good Or Service. Revenue uses this breakdown; costs and expenses retain the consolidated categories.

Net sales
1,591,000,000 US dollars
Cost of goods sold
1,305,000,000 US dollars
Gross profit
286,000,000 US dollars
Total other operating expenses
499,000,000 US dollars
Operating profit (calculated)
negative 213,000,000 US dollars
Other income (expense), net (calculated)
212,000,000 US dollars
Loss before income taxes
negative 1,000,000 US dollars
Provision for income taxes
273,000,000 US dollars
Net loss
negative 274,000,000 US dollars
Advanced Performance Materials - Transferred at a Point in Time
326,000,000 US dollars
Other Non-Reportable Segment - Transferred at a Point in Time
13,000,000 US dollars
Thermal & Specialized Solutions - Transferred at a Point in Time
591,000,000 US dollars
Titanium Technologies - Transferred at a Point in Time
661,000,000 US dollars
Selling, general, and administrative expense
469,000,000 US dollars
Research and development expense
27,000,000 US dollars
Restructuring, asset-related, and other charges
3,000,000 US dollars

Chart connections

  • Revenue less cost of revenue equals gross profit; gross profit less operating expenses equals operating income.
  • Operating income plus other income or expense equals income before tax. Income before tax less income tax expense or benefit equals net income.
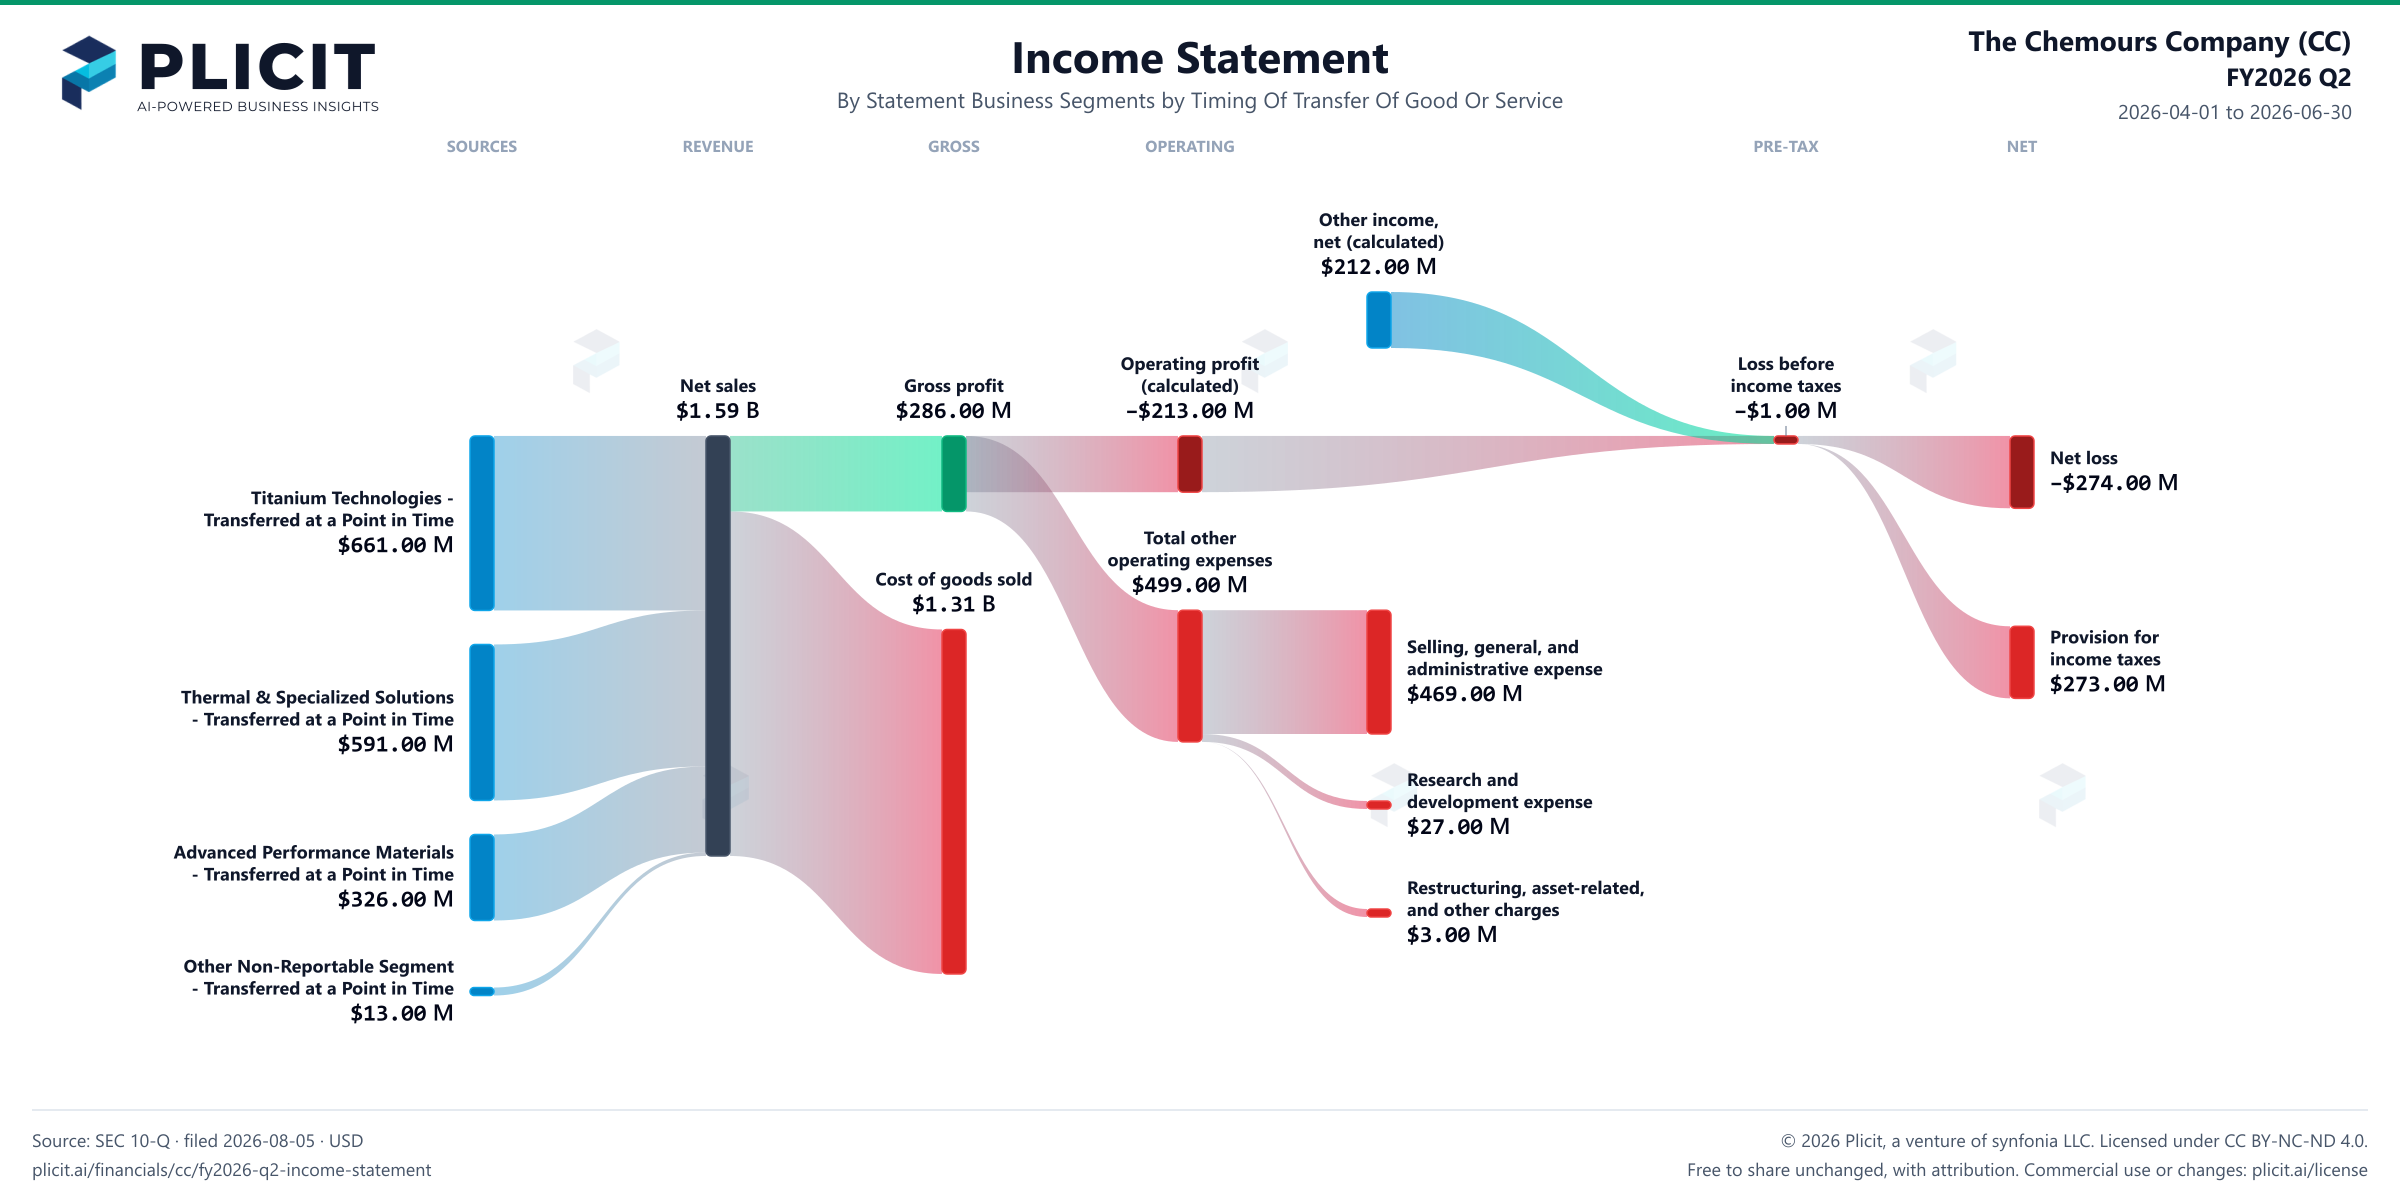
The Chemours Company (CC) FY2026 Q2 P&L / Income Statement Sankey chart, Statement Business Segments by Timing Of Transfer Of Good Or Service view
Free to share unchanged, with credit to Plicit.ai · CC BY-NC-ND 4.0Download PNG

Gross margin

18.0%

Gross profit / revenue

Operating margin

−13.4%

Operating profit / revenue

Newsletter

Get the teardowns by email

Subscribe if you want the public-company teardowns in your inbox when they're released.

Product waitlist

Health Check and Teardown for your own company

A health check uncovers insights of your private books, not a public ticker. Join this list to get notified as soon as we go-live!