
CNX Resources Corporation (CNX) FY2026 YTD Q2 P&L / Income Statement

Revenue by Product and Service

2026-01-01 to 2026-06-30

Swipe to see the full flow
CNX Resources Corporation (CNX) FY2026 YTD Q2 P&L / Income StatementIncome statement for 2026-01-01 through 2026-06-30. View: Product and service. Revenue uses this breakdown; costs and expenses retain the consolidated categories.SOURCESREVENUEGROSSOPERATINGPRE-TAXNETNatural Gas, NGLs and Oil RevenueGain (Loss) on Commodity Derivative InstrumentsPurchased Gas RevenueOther Revenue and Operating IncomeTotal Revenue and Other Operating IncomeGross profit (calculated)Cost of revenue (calculated)Transportation, Gathering and Compression and Exploration and Production Related Other CostsOperating profit (calculated)Operating expenses (calculated)Depreciation, Depletion and AmortizationSelling, General, and Administrative CostsLease Operating ExpensePurchased Gas CostsOther Operating ExpenseProduction, Ad Valorem and Other FeesIncome Before Income TaxTotal Other ExpenseNet IncomeIncome Tax ExpenseTotal Revenue and Other Operating IncomeTotal Revenue andOther Operating Income$1.41 BGross profit (calculated)Gross profit(calculated)$1.19 BOperating profit (calculated)Operating profit(calculated)$752.80 MIncome Before Income TaxIncome BeforeIncome Tax$665.35 MNet IncomeNet Income$551.09 MNatural Gas, NGLs and Oil RevenueNatural Gas, NGLs and Oil Revenue$1.11 BOperating expenses (calculated)Operating expenses(calculated)$439.79 MIncome Tax ExpenseIncome Tax Expense$114.26 MDepreciation, Depletion and AmortizationDepreciation, Depletionand Amortization$270.85 MTotal Other ExpenseTotal Other Expense−$87.45 MGain (Loss) on Commodity Derivative InstrumentsGain (Loss) on CommodityDerivative Instruments$180.32 MCost of revenue (calculated)Cost of revenue(calculated)$212.55 MSelling, General, and Administrative CostsSelling, General, andAdministrative Costs$66.08 MPurchased Gas RevenuePurchased Gas Revenue$25.14 MTransportation, Gathering and Compression and Exploration and Production Related Other CostsTransportation,Gathering andCompression and…$212.55 MOther Revenue and Operating IncomeOther Revenue and Operating Income$88.20 MLease Operating ExpenseLease Operating Expense$43.03 MPurchased Gas CostsPurchased Gas Costs$24.50 MOther Operating ExpenseOther Operating Expense$19.99 MProduction, Ad Valorem and Other FeesProduction, Ad Valoremand Other Fees$15.34 M
Chart details

CNX Resources Corporation (CNX) FY2026 YTD Q2 P&L / Income Statement

Income statement for 2026-01-01 through 2026-06-30. View: Product and service. Revenue uses this breakdown; costs and expenses retain the consolidated categories.

Total Revenue and Other Operating Income
1,405,138,000 US dollars
Cost of revenue (calculated)
212,553,000 US dollars
Gross profit (calculated)
1,192,585,000 US dollars
Operating expenses (calculated)
439,785,000 US dollars
Operating profit (calculated)
752,800,000 US dollars
Total Other Expense
negative 87,453,000 US dollars
Income Before Income Tax
665,347,000 US dollars
Income Tax Expense
114,257,000 US dollars
Net Income
551,090,000 US dollars
Purchased Gas Revenue
25,143,000 US dollars
Natural Gas, NGLs and Oil Revenue
1,111,478,000 US dollars
Other Revenue and Operating Income
88,200,000 US dollars
Gain (Loss) on Commodity Derivative Instruments
180,317,000 US dollars
Transportation, Gathering and Compression and Exploration and Production Related Other Costs
212,553,000 US dollars
Lease Operating Expense
43,032,000 US dollars
Production, Ad Valorem and Other Fees
15,335,000 US dollars
Depreciation, Depletion and Amortization
270,845,000 US dollars
Purchased Gas Costs
24,502,000 US dollars
Selling, General, and Administrative Costs
66,082,000 US dollars
Other Operating Expense
19,989,000 US dollars

Chart connections

  • Revenue less cost of revenue equals gross profit; gross profit less operating expenses equals operating income.
  • Operating income plus other income or expense equals income before tax. Income before tax less income tax expense or benefit equals net income.
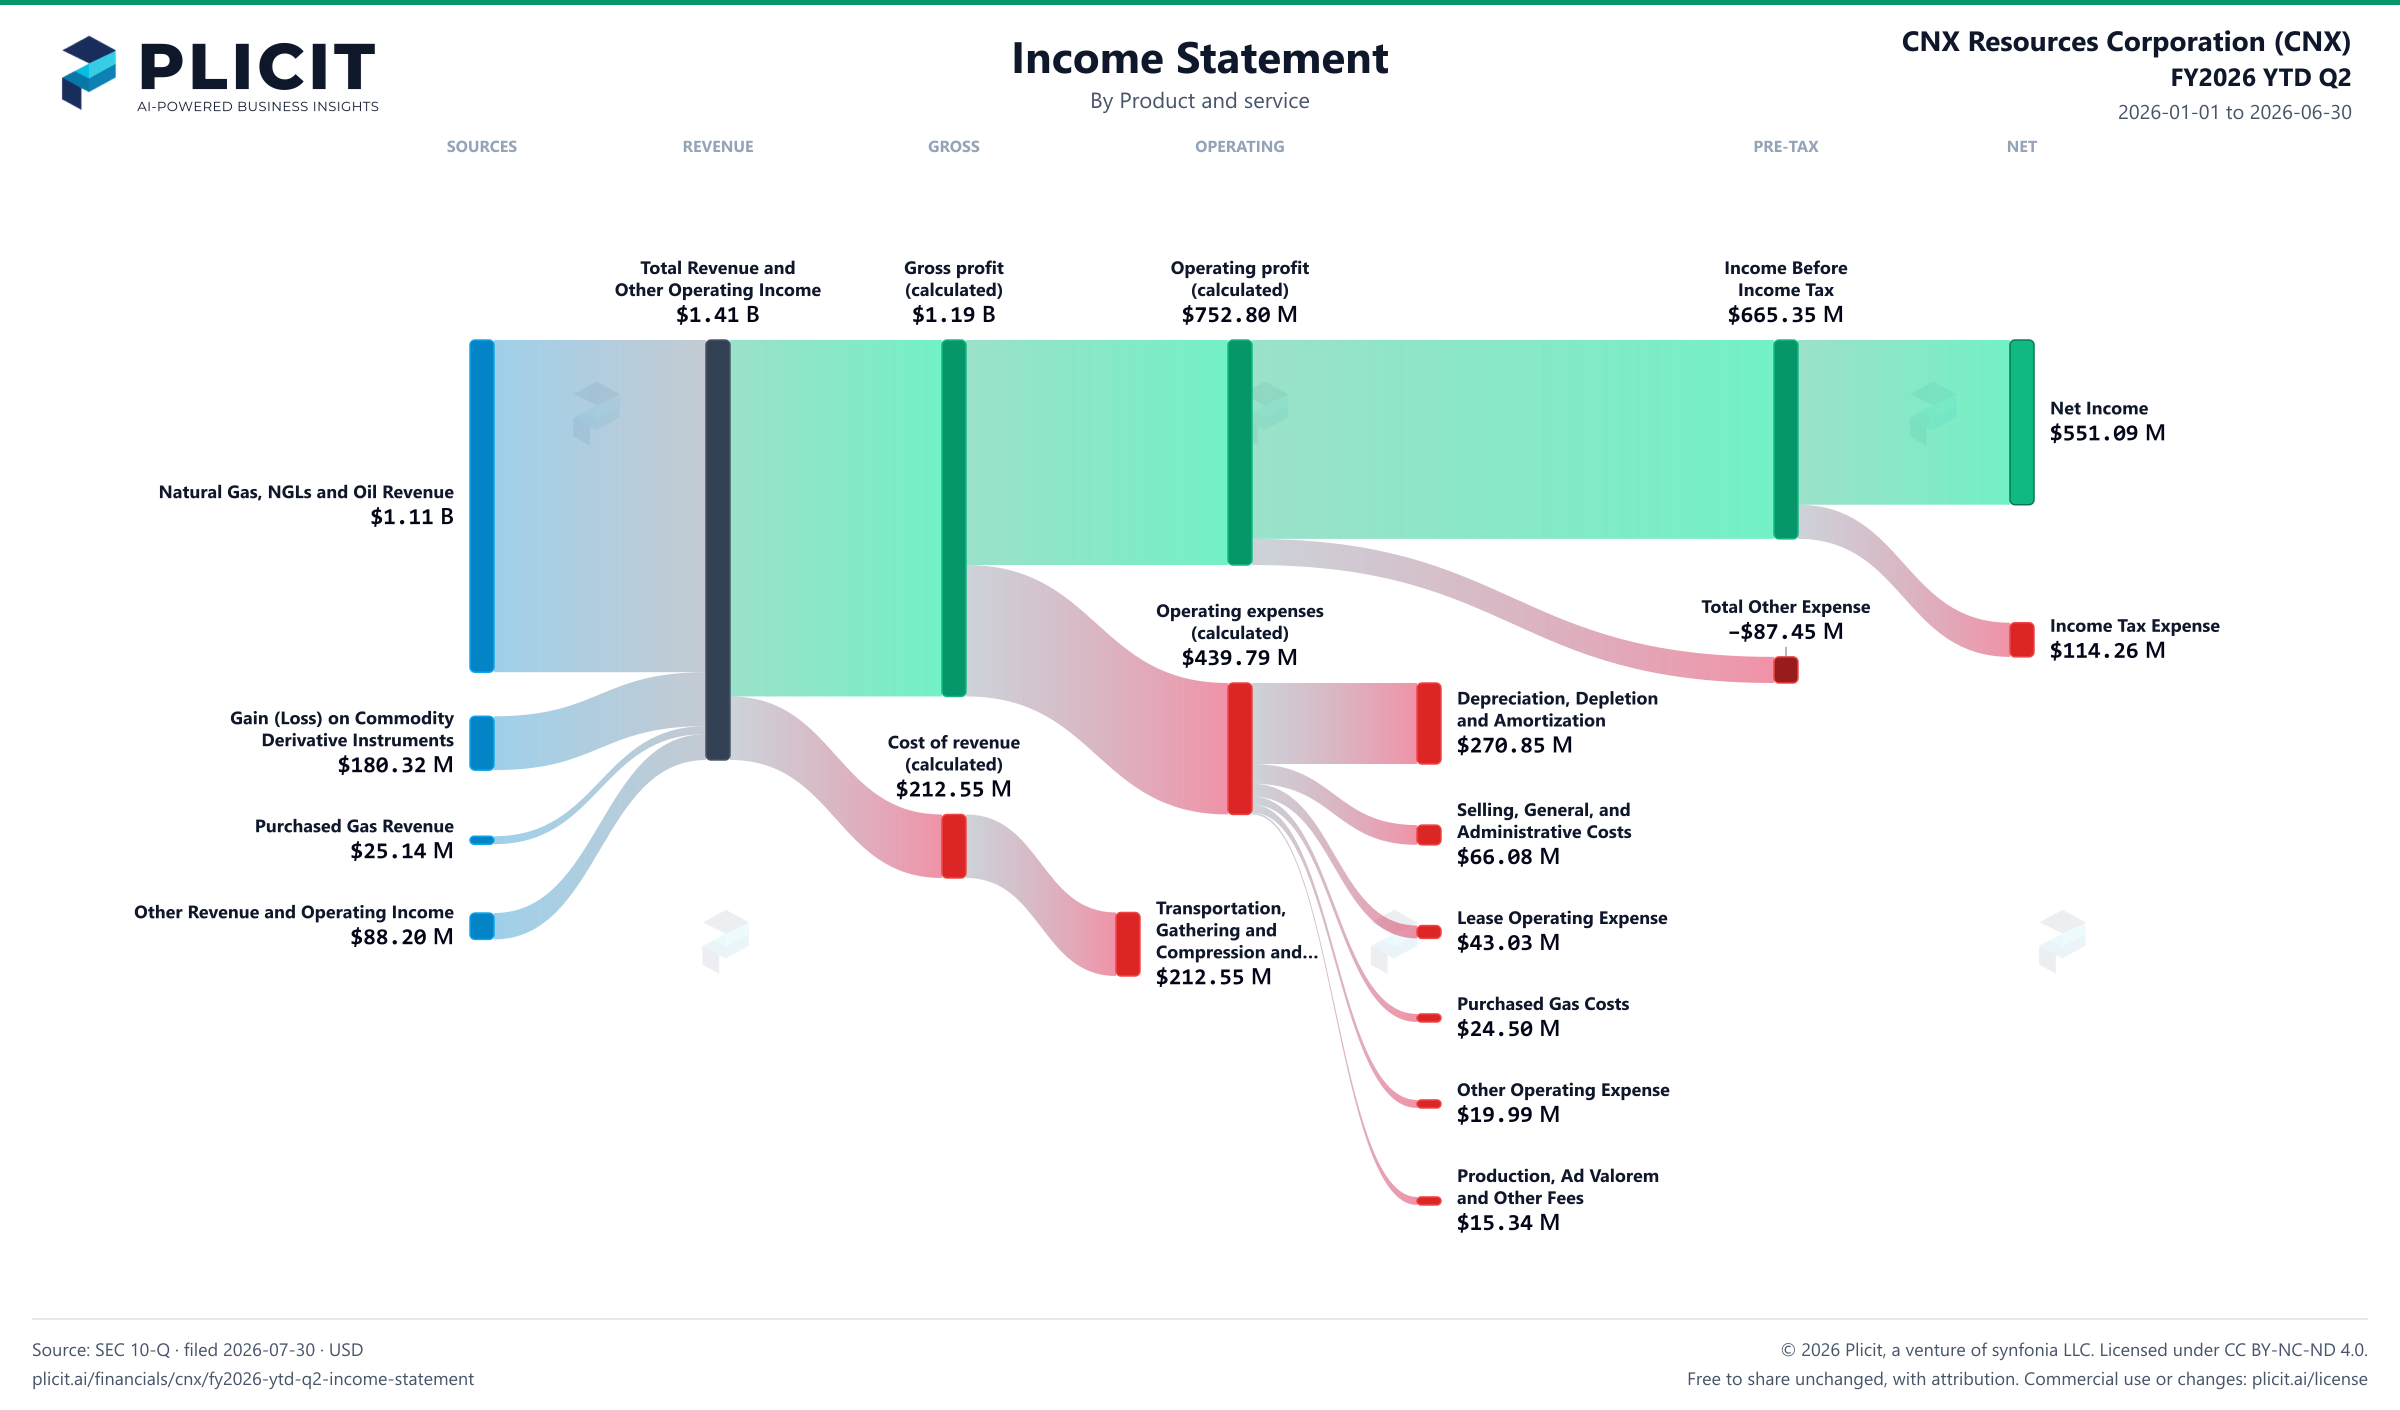
CNX Resources Corporation (CNX) FY2026 YTD Q2 P&L / Income Statement Sankey chart, Product and service view
Free to share unchanged, with credit to Plicit.ai · CC BY-NC-ND 4.0Download PNG

Gross margin

84.9%

Gross profit / revenue

Operating margin

53.6%

Operating profit / revenue

Cash conversion

101.1%

Operating cash / net income, same period

Newsletter

Get the teardowns by email

Subscribe if you want the public-company teardowns in your inbox when they're released.

Product waitlist

Health Check and Teardown for your own company

A health check uncovers insights of your private books, not a public ticker. Join this list to get notified as soon as we go-live!