
AMERICOLD REALTY TRUST, INC. (COLD) FY2026 Q2 P&L / Income Statement

Revenue by Business Segment

2026-04-01 to 2026-06-30

Swipe to see the full flow
AMERICOLD REALTY TRUST, INC. (COLD) FY2026 Q2 P&L / Income StatementIncome statement for 2026-04-01 through 2026-06-30. View: Business segment. Revenue and costs use their disclosed categories.SOURCESREVENUEGROSSOPERATINGPRE-TAXNETRent, storage, and warehouse services revenueTransportation services cost of operations revenueTotal revenuesGross profit (calculated)Total segment expensesRent, storage, and warehouse services cost of revenueTransportation services cost of operations cost of revenueOperating (loss) incomeOperating expenses (calculated)Impairment of long-lived assetsDepreciation and amortizationSelling, general, and administrativeNet gain from sale of real estateTransactions, strategic initiatives and other costs, net(Loss) income before income taxesOther income (expense), net (calculated)Net (loss) incomeTotal income tax expenseGross profit (calculated)Gross profit(calculated)$212.69 MOperating (loss) incomeOperating(loss) income−$287.83 M(Loss) income before income taxes(Loss) incomebefore income taxes−$323.73 MTotal revenuesTotal revenues$662.89 MNet (loss) incomeNet (loss) income−$346.46 MRent, storage, and warehouse services revenueRent, storage, andwarehouse services$603.57 MTotal segment expensesTotal segmentexpenses$450.20 MOperating expenses (calculated)Operating expenses(calculated)$500.52 MTotal income tax expenseTotal incometax expense$22.73 MImpairment of long-lived assetsImpairment of long-lived assets$309.57 MTransportation services cost of operations revenueTransportation servicescost of operations$59.32 MRent, storage, and warehouse services cost of revenueRent, storage, andwarehouse services$401.84 MDepreciation and amortizationDepreciation and amortization$102.93 MTransportation services cost of operations cost of revenueTransportationservices costof operations$48.37 MSelling, general, and administrativeSelling, general, and administrative$62.86 MNet gain from sale of real estateNet gain from sale of real estate−$3.32 MOther income (expense), net (calculated)Other income,net (calculated)−$35.89 MTransactions, strategic initiatives and other costs, netTransactions, strategicinitiatives and other costs, net$28.47 M
Chart details

AMERICOLD REALTY TRUST, INC. (COLD) FY2026 Q2 P&L / Income Statement

Income statement for 2026-04-01 through 2026-06-30. View: Business segment. Revenue and costs use their disclosed categories.

Total revenues
662,890,000 US dollars
Total segment expenses
450,203,000 US dollars
Gross profit (calculated)
212,687,000 US dollars
Operating expenses (calculated)
500,521,000 US dollars
Operating (loss) income
negative 287,834,000 US dollars
Other income (expense), net (calculated)
negative 35,892,000 US dollars
(Loss) income before income taxes
negative 323,726,000 US dollars
Total income tax expense
22,734,000 US dollars
Net (loss) income
negative 346,460,000 US dollars
Rent, storage, and warehouse services revenue
603,573,000 US dollars
Transportation services cost of operations revenue
59,317,000 US dollars
Rent, storage, and warehouse services cost of revenue
401,838,000 US dollars
Transportation services cost of operations cost of revenue
48,365,000 US dollars
Depreciation and amortization
102,931,000 US dollars
Selling, general, and administrative
62,864,000 US dollars
Transactions, strategic initiatives and other costs, net
28,470,000 US dollars
Impairment of long-lived assets
309,572,000 US dollars
Net gain from sale of real estate
negative 3,316,000 US dollars

Chart connections

  • Revenue less cost of revenue equals gross profit; gross profit less operating expenses equals operating income.
  • Operating income plus other income or expense equals income before tax. Income before tax less income tax expense or benefit equals net income.
  • Of which attributable to AMERICOLD REALTY TRUST, INC.: −$342.81 M; to noncontrolling interests: −$3.65 M.
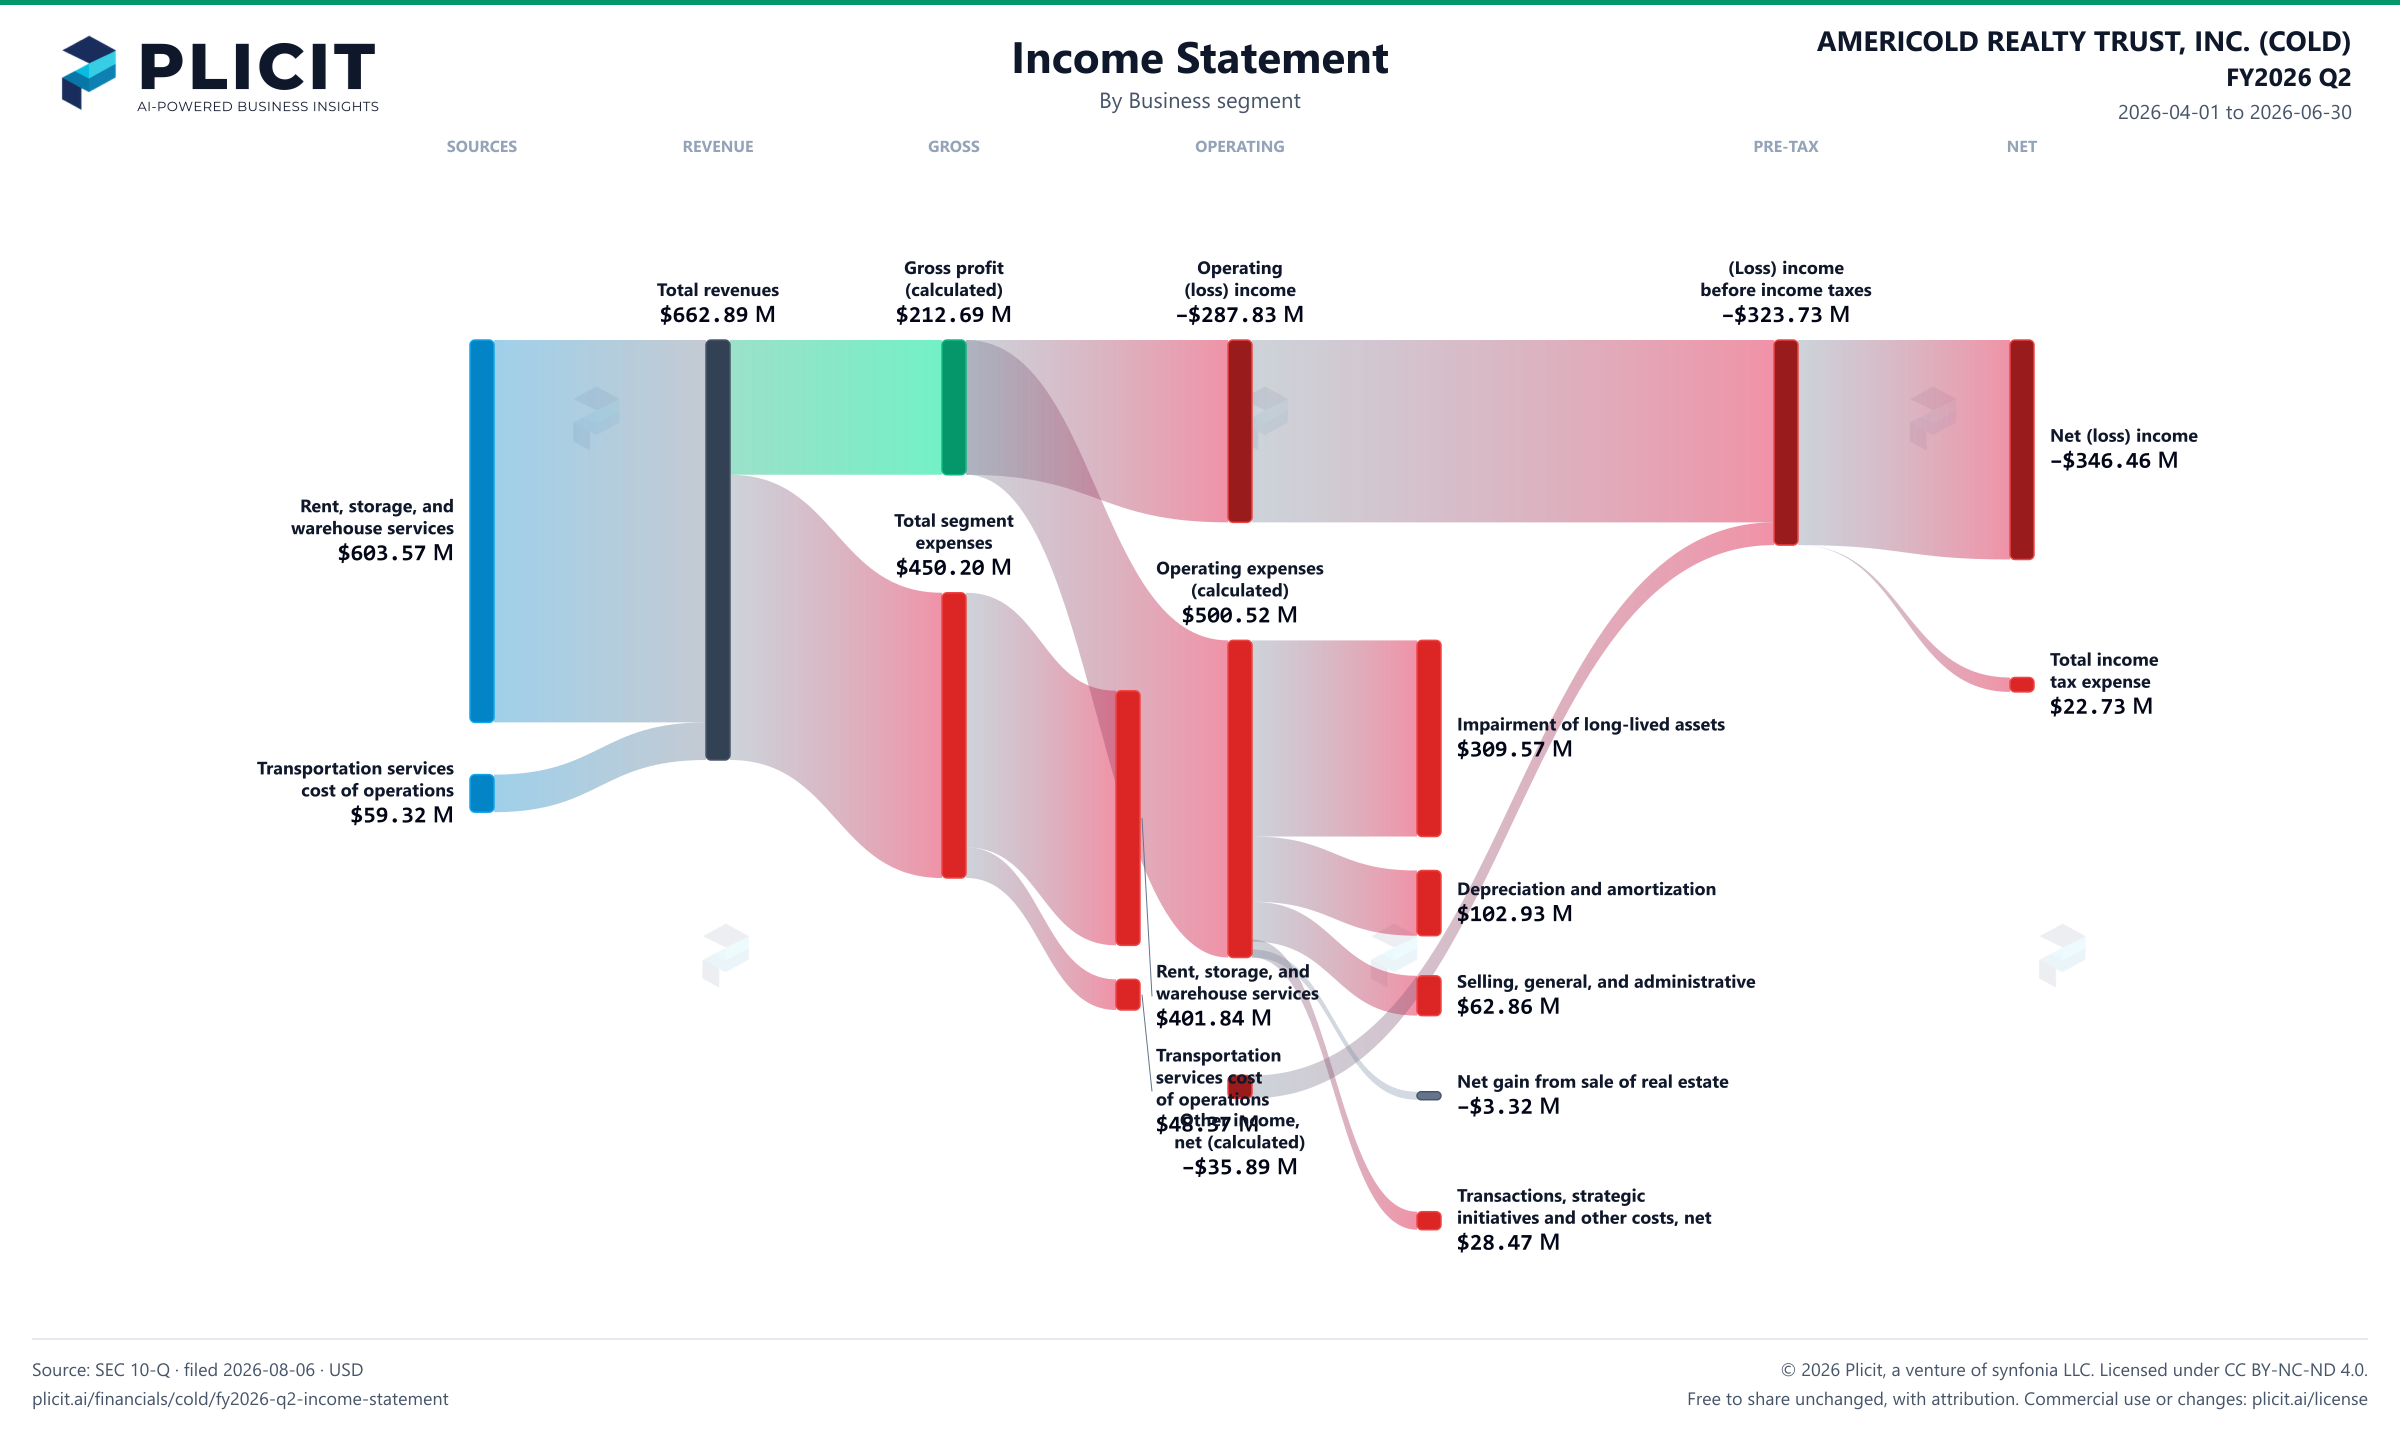
AMERICOLD REALTY TRUST, INC. (COLD) FY2026 Q2 P&L / Income Statement Sankey chart, Business segment view
Free to share unchanged, with credit to Plicit.ai · CC BY-NC-ND 4.0Download PNG

Gross margin

32.1%

Gross profit / revenue

Operating margin

−43.4%

Operating profit / revenue

Newsletter

Get the teardowns by email

Subscribe if you want the public-company teardowns in your inbox when they're released.

Product waitlist

Health Check and Teardown for your own company

A health check uncovers insights of your private books, not a public ticker. Join this list to get notified as soon as we go-live!