
CIRCLE INTERNET GROUP, INC. (CRCL) FY2026 Q2 P&L / Income Statement

Revenue by Product and Service

2026-04-01 to 2026-06-30

Swipe to see the full flow
CIRCLE INTERNET GROUP, INC. (CRCL) FY2026 Q2 P&L / Income StatementIncome statement for 2026-04-01 through 2026-06-30. View: Revenue categories. Revenue uses this breakdown; costs and expenses retain the consolidated categories.SOURCESREVENUEOPERATINGPRE-TAXNETReserve incomeOther revenueTotal revenue and reserve incomeOperating income (loss) from continuing operationsOperating costs, including other operating expenses (calculated)Compensation expensesGeneral and administrative expensesDepreciation and amortization expensesIT infrastructure costsMarketing expensesDigital assets losses (gains)Total distribution, transaction and other costsOther income (expense), netNet income (loss) from continuing operations before income taxesNet income (loss) attributable to common stockholdersIncome tax expense (benefit)Less: Net loss attributable to noncontrolling interestsLess: Net loss attributable to noncontrolling interestsLess: Net lossattributable tononcontrolling…$7.00 KOther income (expense), netOther income(expense), net$17.95 MNet income (loss) from continuing operations before income taxesNet income (loss) fromcontinuing operationsbefore income taxes$52.31 MOperating income (loss) from continuing operationsOperating income(loss) fromcontinuing operations$34.36 MTotal revenue and reserve incomeTotal revenue andreserve income$701.32 MNet income (loss) attributable to common stockholdersNet income (loss)attributable tocommon stockholders$48.22 MOperating costs, including other operating expenses (calculated)Operating costs(calculated)$666.96 MIncome tax expense (benefit)Income taxexpense (benefit)$4.09 MCompensation expensesCompensation expenses$134.00 MReserve incomeReserve income$667.73 MGeneral and administrative expensesGeneral andadministrative expenses$66.27 MDepreciation and amortization expensesDepreciation andamortization expenses$29.90 MOther revenueOther revenue$33.58 MIT infrastructure costsIT infrastructure costs$16.36 MMarketing expensesMarketing expenses$8.66 MDigital assets losses (gains)Digital assets losses (gains)−$698.00 KTotal distribution, transaction and other costsTotal distribution,transaction and other costs$412.47 M
Chart details

CIRCLE INTERNET GROUP, INC. (CRCL) FY2026 Q2 P&L / Income Statement

Income statement for 2026-04-01 through 2026-06-30. View: Revenue categories. Revenue uses this breakdown; costs and expenses retain the consolidated categories.

Total revenue and reserve income
701,315,000 US dollars
Operating costs, including other operating expenses (calculated)
666,956,000 US dollars
Operating income (loss) from continuing operations
34,359,000 US dollars
Other income (expense), net
17,947,000 US dollars
Net income (loss) from continuing operations before income taxes
52,306,000 US dollars
Income tax expense (benefit)
4,092,000 US dollars
Net income (loss) attributable to common stockholders
48,221,000 US dollars
Reserve income
667,733,000 US dollars
Other revenue
33,582,000 US dollars
Compensation expenses
133,999,000 US dollars
General and administrative expenses
66,273,000 US dollars
Depreciation and amortization expenses
29,896,000 US dollars
IT infrastructure costs
16,359,000 US dollars
Marketing expenses
8,657,000 US dollars
Digital assets losses (gains)
negative 698,000 US dollars
Total distribution, transaction and other costs
412,470,000 US dollars
Less: Net loss attributable to noncontrolling interests
7,000 US dollars. Reported below-tax contribution to net income.

Chart connections

  • Revenue minus operating expenses equals operating income.
  • Operating income plus other income or expense equals income before tax. Income before tax less income tax expense or benefit, plus the explicitly reported below-tax contributions, equals net income.
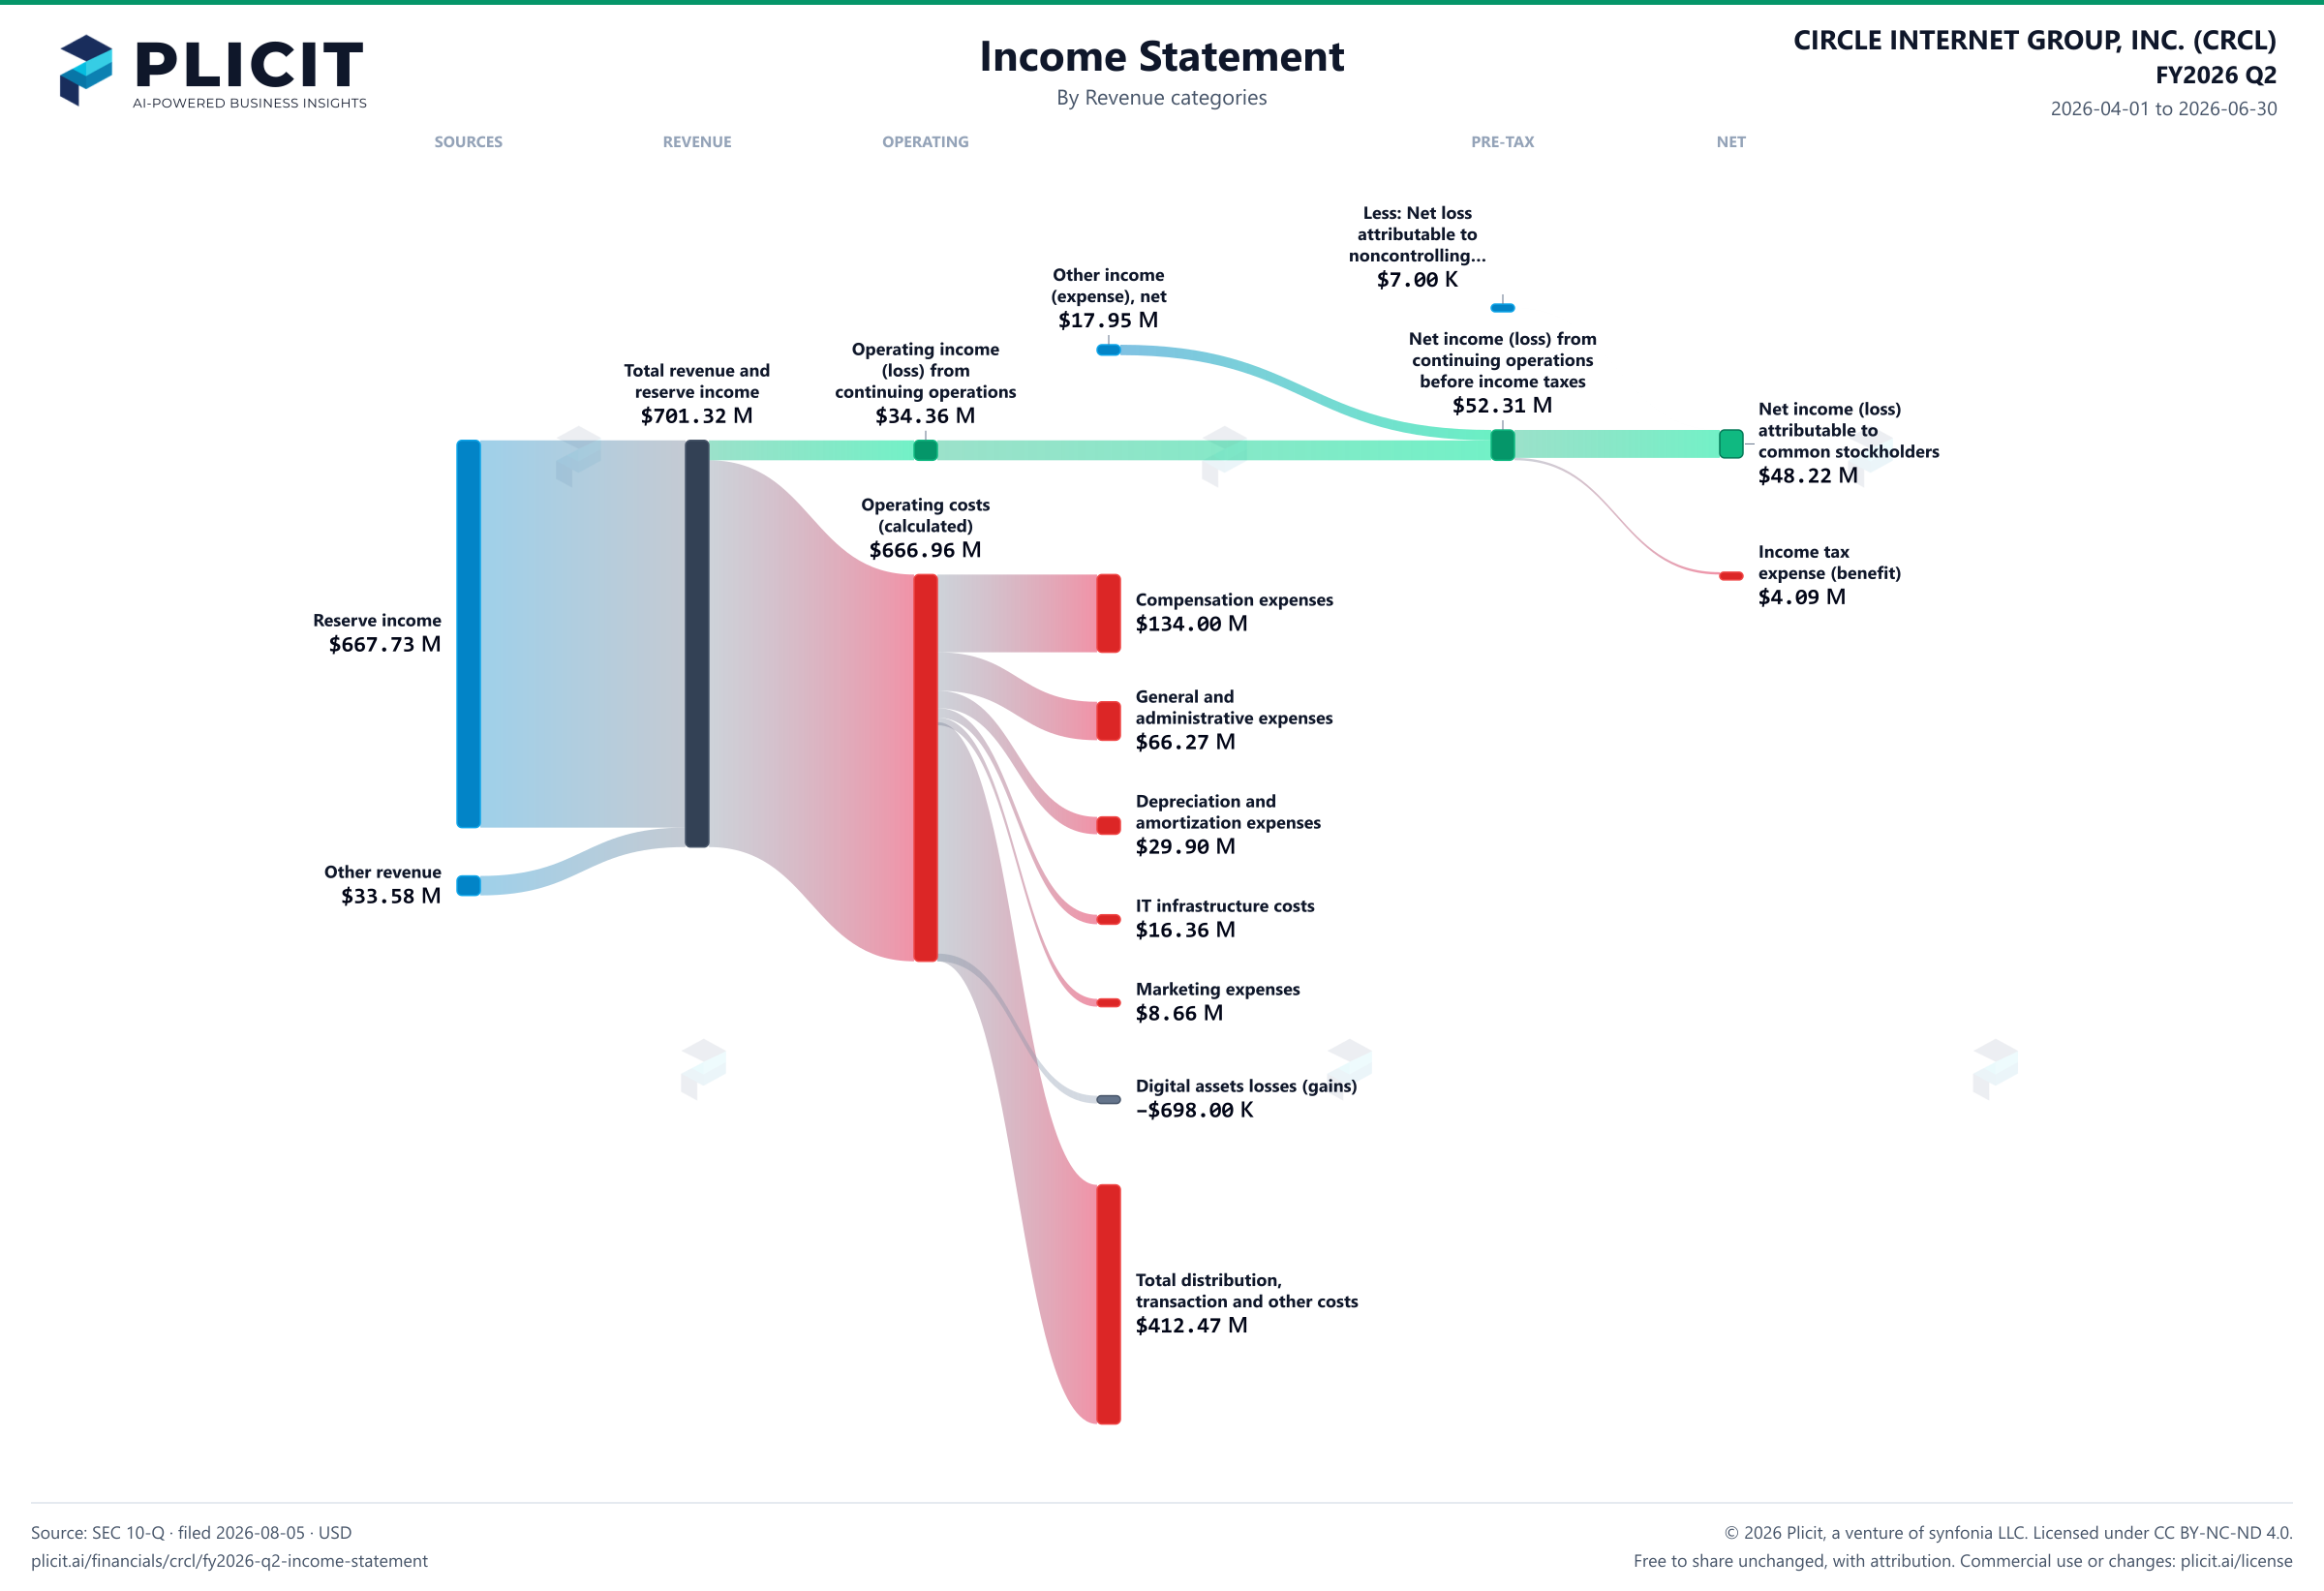
CIRCLE INTERNET GROUP, INC. (CRCL) FY2026 Q2 P&L / Income Statement Sankey chart
Free to share unchanged, with credit to Plicit.ai · CC BY-NC-ND 4.0Download PNG

Operating margin

4.9%

Operating profit / revenue

Cash conversion

1073.0%

Operating cash / net income, same period

Newsletter

Get the teardowns by email

Subscribe if you want the public-company teardowns in your inbox when they're released.

Product waitlist

Health Check and Teardown for your own company

A health check uncovers insights of your private books, not a public ticker. Join this list to get notified as soon as we go-live!