
COGNIZANT TECHNOLOGY SOLUTIONS CORPORATION (CTSH) FY2026 YTD Q2 P&L / Income Statement

2026-01-01 to 2026-06-30

Swipe to see the full flow
COGNIZANT TECHNOLOGY SOLUTIONS CORPORATION (CTSH) FY2026 YTD Q2 P&L / Income StatementIncome statement for 2026-01-01 through 2026-06-30. View: Segments by Product and Service. Revenue uses this breakdown; costs and expenses retain the consolidated categories.SOURCESREVENUEGROSSOPERATINGPRE-TAXNETFinancial Services - Consulting And Technology ServicesHealthcare Segment - Consulting And Technology ServicesProducts and Resources - Consulting And Technology ServicesHealthcare Segment - Outsourcing ServicesFinancial Services - Outsourcing ServicesCommunications, Media and Technology - Consulting And Technology ServicesProducts and Resources - Outsourcing ServicesCommunications, Media and Technology - Outsourcing ServicesRevenuesGross profit (calculated)Cost of revenue (calculated)Cost of revenues (exclusive of depreciation and amortization expense shown separately below)Income from operationsOperating costs, net of other operating income (calculated)Selling, general and administrative expensesDepreciation and amortization expenseRestructuring chargesTotal other income (expense), netIncome before provision for income taxesNet incomeProvision for income taxesIncome (Loss) from Equity Method InvestmentsTotal other income (expense), netTotal other income(expense), net$25.00 MIncome before provision for income taxesIncome beforeprovision forincome taxes$1.74 BGross profit (calculated)Gross profit(calculated)$3.60 BRevenuesRevenues$10.89 BIncome from operationsIncome from operations$1.72 BNet incomeNet income$1.30 BFinancial Services - Consulting And Technology ServicesFinancial Services - ConsultingAnd Technology Services$2.44 BOperating costs, net of other operating income (calculated)Operating costs,net (calculated)$1.89 BHealthcare Segment - Consulting And Technology ServicesHealthcare Segment - ConsultingAnd Technology Services$1.84 BProvision for income taxesProvision forincome taxes$439.00 MCost of revenue (calculated)Cost of revenue(calculated)$7.29 BSelling, general and administrative expensesSelling, general andadministrative expenses$1.52 BProducts and Resources - Consulting And Technology ServicesProducts and Resources -Consulting And Technology Services$1.80 BDepreciation and amortization expenseDepreciation andamortization expense$284.00 MIncome (Loss) from Equity Method InvestmentsIncome (Loss)from Equity MethodInvestments−$5.00 MHealthcare Segment - Outsourcing ServicesHealthcare Segment -Outsourcing Services$1.31 BRestructuring chargesRestructuring charges$84.00 MFinancial Services - Outsourcing ServicesFinancial Services -Outsourcing Services$937.00 MCost of revenues (exclusive of depreciation and amortization expense shown separately below)Cost of revenues$7.29 BCommunications, Media and Technology - Consulting And Technology ServicesCommunications, Media andTechnology - ConsultingAnd Technology Services$930.00 MProducts and Resources - Outsourcing ServicesProducts and Resources- Outsourcing Services$842.00 MCommunications, Media and Technology - Outsourcing ServicesCommunications, Media andTechnology - Outsourcing Services$793.00 M
Chart details

COGNIZANT TECHNOLOGY SOLUTIONS CORPORATION (CTSH) FY2026 YTD Q2 P&L / Income Statement

Income statement for 2026-01-01 through 2026-06-30. View: Segments by Product and Service. Revenue uses this breakdown; costs and expenses retain the consolidated categories.

Revenues
10,894,000,000 US dollars
Cost of revenue (calculated)
7,290,000,000 US dollars
Gross profit (calculated)
3,604,000,000 US dollars
Operating costs, net of other operating income (calculated)
1,887,000,000 US dollars
Income from operations
1,717,000,000 US dollars
Total other income (expense), net
25,000,000 US dollars
Income before provision for income taxes
1,742,000,000 US dollars
Provision for income taxes
439,000,000 US dollars
Net income
1,298,000,000 US dollars
Communications, Media and Technology - Consulting And Technology Services
930,000,000 US dollars
Communications, Media and Technology - Outsourcing Services
793,000,000 US dollars
Financial Services - Consulting And Technology Services
2,440,000,000 US dollars
Financial Services - Outsourcing Services
937,000,000 US dollars
Healthcare Segment - Consulting And Technology Services
1,838,000,000 US dollars
Healthcare Segment - Outsourcing Services
1,313,000,000 US dollars
Products and Resources - Consulting And Technology Services
1,801,000,000 US dollars
Products and Resources - Outsourcing Services
842,000,000 US dollars
Cost of revenues (exclusive of depreciation and amortization expense shown separately below)
7,290,000,000 US dollars
Selling, general and administrative expenses
1,519,000,000 US dollars
Restructuring charges
84,000,000 US dollars
Depreciation and amortization expense
284,000,000 US dollars
(Gain) on sale of property and equipment
0 US dollars
Income (Loss) from Equity Method Investments
negative 5,000,000 US dollars. Reported below-tax contribution to net income.

Chart connections

  • Revenue less cost of revenue equals gross profit; gross profit less operating expenses equals operating income.
  • Operating income plus other income or expense equals income before tax. Income before tax less income tax expense or benefit, plus the explicitly reported below-tax contributions, equals net income.
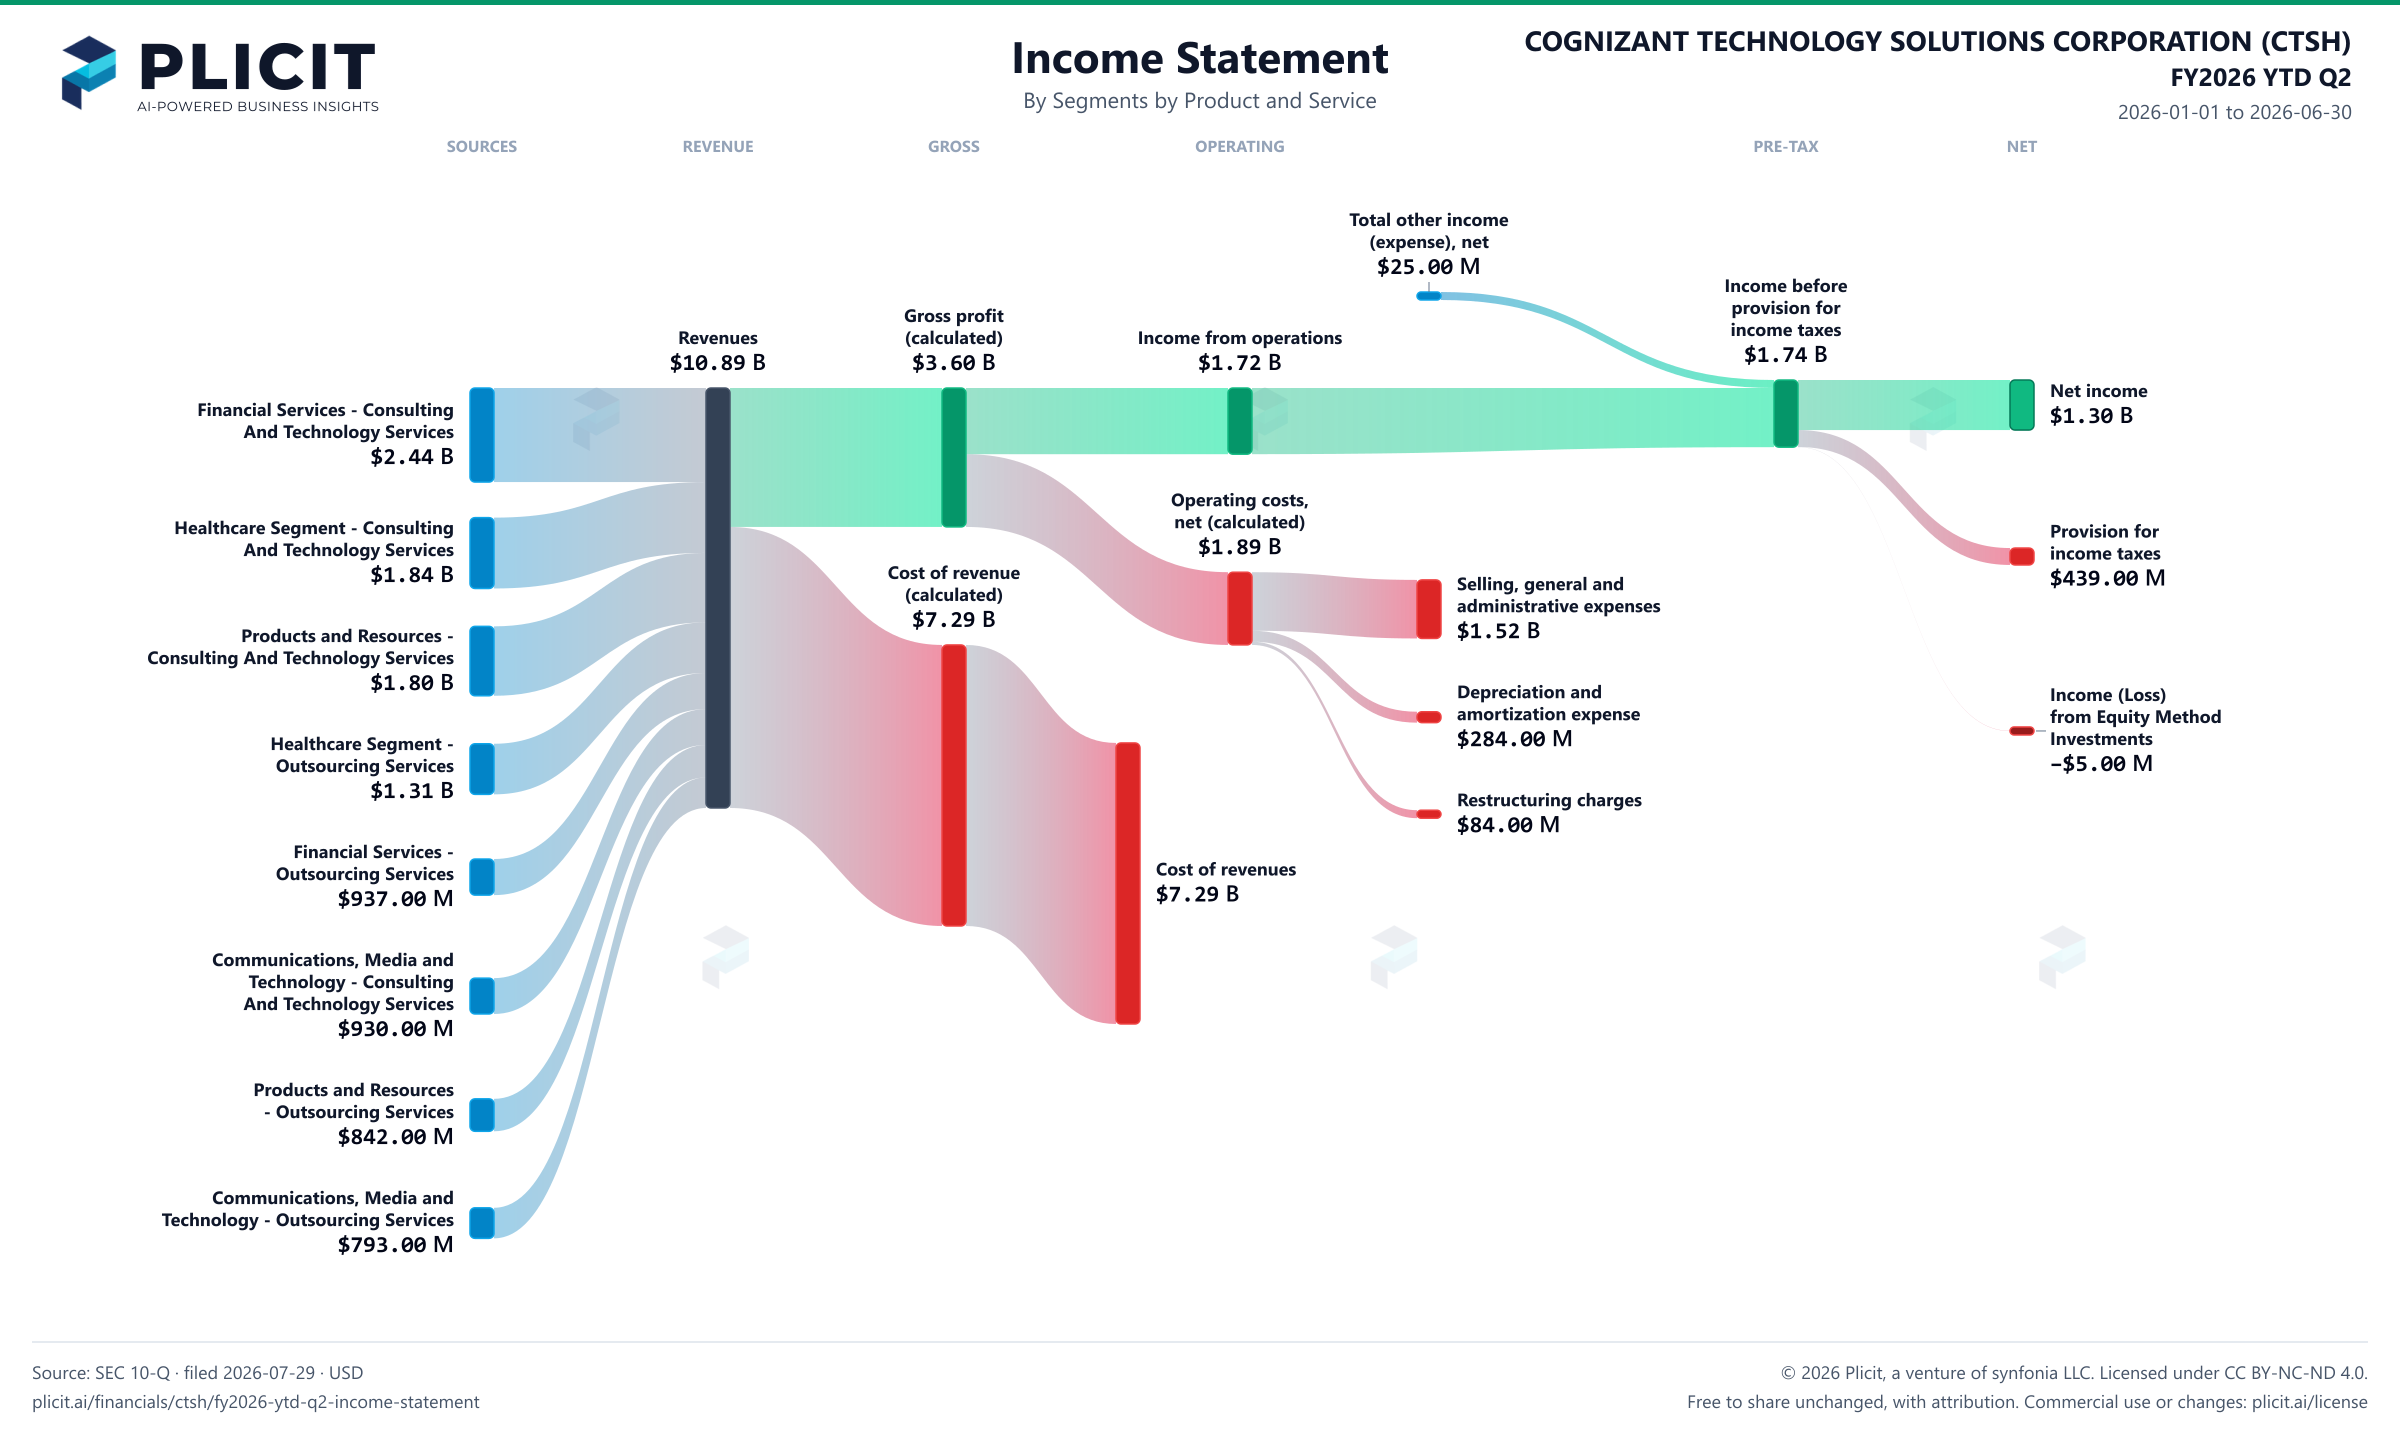
COGNIZANT TECHNOLOGY SOLUTIONS CORPORATION (CTSH) FY2026 YTD Q2 Revenue by Business Segment by Product and Service Sankey chart
Free to share unchanged, with credit to Plicit.ai · CC BY-NC-ND 4.0Download PNG

Gross margin

33.1%

Gross profit / revenue

Operating margin

15.8%

Operating profit / revenue

Cash conversion

64.1%

Operating cash / net income, same period

Newsletter

Get the teardowns by email

Subscribe if you want the public-company teardowns in your inbox when they're released.

Product waitlist

Health Check and Teardown for your own company

A health check uncovers insights of your private books, not a public ticker. Join this list to get notified as soon as we go-live!