
ECOLAB INC. (ECL) FY2024 YTD Q3 P&L / Income Statement

2024-01-01 to 2024-09-30

Swipe to see the full flow
ECOLAB INC. (ECL) FY2024 YTD Q3 P&L / Income StatementIncome statement for 2024-01-01 through 2024-09-30. View: Segments by Geographical. Revenue uses this breakdown; costs and expenses retain the consolidated categories.SOURCESREVENUEGROSSOPERATINGPRE-TAXNETGlobal Institutional and Specialty - U.S. Pension.Global Industrial - U.S. Pension.Global Industrial - EuropeGlobal Industrial - Asia PacificGlobal Pest Elimination - U.S. Pension.Global Industrial - Latin AmericaGlobal Healthcare and Life Sciences - EuropeGlobal Institutional and Specialty - EuropeGlobal Healthcare and Life Sciences - U.S. Pension.Global Industrial - India, Middle East and AfricaGlobal Industrial - Greater ChinaGlobal Institutional and Specialty - Asia PacificGlobal Institutional and Specialty - CanadaGlobal Industrial - CanadaGlobal Institutional and Specialty - Latin AmericaGlobal Pest Elimination - EuropeGlobal Institutional and Specialty - Greater ChinaGlobal Healthcare and Life Sciences - Asia PacificGlobal Institutional and Specialty - India, Middle East and AfricaGlobal Pest Elimination - Greater ChinaGlobal Pest Elimination - Latin AmericaGlobal Healthcare and Life Sciences - Greater ChinaGlobal Pest Elimination - Asia PacificGlobal Healthcare and Life Sciences - India, Middle East and AfricaGlobal Healthcare and Life Sciences - Latin AmericaGlobal Pest Elimination - CanadaGlobal Pest Elimination - India, Middle East and AfricaGlobal Healthcare and Life Sciences - CanadaNet salesGross profit (calculated)Cost of sales (including special charges (a))Operating incomeOperating expenses (calculated)Selling, general and administrative expensesSpecial (gains) and chargesIncome before income taxesOther income (expense), net (calculated)Net income including noncontrolling interestProvision for income taxesGross profit (calculated)Gross profit(calculated)$5.11 BNet salesNet sales$11.74 BOperating incomeOperating income$2.22 BIncome before income taxesPretax income$2.04 BNet income including noncontrolling interestNet income includingnoncontrolling interest$1.65 BGlobal Institutional and Specialty - U.S. Pension.Global Institutional andSpecialty - U.S. Pension.$2.82 BOperating expenses (calculated)Operating expenses(calculated)$2.89 BProvision for income taxesProvision forincome taxes$384.50 MGlobal Industrial - U.S. Pension.Global Industrial - U.S. Pension.$2.47 BOther income (expense), net (calculated)Other income,net (calculated)−$182.70 MSelling, general and administrative expensesSelling, general andadministrative expenses$3.18 BCost of sales (including special charges (a))Cost of sales$6.63 BGlobal Industrial - EuropeGlobal Industrial - Europe$1.21 BSpecial (gains) and chargesSpecial (gains) and charges−$292.20 MGlobal Industrial - Asia PacificGlobal Industrial - Asia Pacific$692.90 MGlobal Pest Elimination - U.S. Pension.Global Pest Elimination - U.S. Pension.$605.70 MGlobal Industrial - Latin AmericaGlobal Industrial - Latin America$582.00 MGlobal Healthcare and Life Sciences - EuropeGlobal Healthcare andLife Sciences - Europe$543.60 MGlobal Institutional and Specialty - EuropeGlobal Institutionaland Specialty - Europe$525.50 MGlobal Healthcare and Life Sciences - U.S. Pension.Global Healthcare and LifeSciences - U.S. Pension.$399.40 MGlobal Industrial - India, Middle East and AfricaGlobal Industrial - India,Middle East and Africa$323.50 MGlobal Industrial - Greater ChinaGlobal Industrial - Greater China$297.90 MGlobal Institutional and Specialty - Asia PacificGlobal Institutional andSpecialty - Asia Pacific$178.10 MGlobal Institutional and Specialty - CanadaGlobal Institutionaland Specialty - Canada$177.70 MGlobal Industrial - CanadaGlobal Industrial - Canada$163.10 MGlobal Institutional and Specialty - Latin AmericaGlobal Institutional andSpecialty - Latin America$144.50 MGlobal Pest Elimination - EuropeGlobal Pest Elimination - Europe$136.60 MGlobal Institutional and Specialty - Greater ChinaGlobal Institutional andSpecialty - Greater China$130.00 MGlobal Healthcare and Life Sciences - Asia PacificGlobal Healthcare and LifeSciences - Asia Pacific$76.50 MGlobal Institutional and Specialty - India, Middle East and AfricaGlobal Institutional and Specialty- India, Middle East and Africa$54.00 MGlobal Pest Elimination - Greater ChinaGlobal Pest Elimination- Greater China$44.90 MGlobal Pest Elimination - Latin AmericaGlobal Pest Elimination- Latin America$44.30 MGlobal Healthcare and Life Sciences - Greater ChinaGlobal Healthcare and LifeSciences - Greater China$38.00 MGlobal Pest Elimination - Asia PacificGlobal Pest Elimination - Asia Pacific$23.60 MGlobal Healthcare and Life Sciences - India, Middle East and AfricaGlobal Healthcare and Life Sciences- India, Middle East and Africa$19.60 MGlobal Healthcare and Life Sciences - Latin AmericaGlobal Healthcare and LifeSciences - Latin America$17.90 MGlobal Pest Elimination - CanadaGlobal Pest Elimination - Canada$8.70 MGlobal Pest Elimination - India, Middle East and AfricaGlobal Pest Elimination -India, Middle East and Africa$5.20 MGlobal Healthcare and Life Sciences - CanadaGlobal Healthcare andLife Sciences - Canada$5.00 M
Chart details

ECOLAB INC. (ECL) FY2024 YTD Q3 P&L / Income Statement

Income statement for 2024-01-01 through 2024-09-30. View: Segments by Geographical. Revenue uses this breakdown; costs and expenses retain the consolidated categories.

Net sales
11,736,200,000 US dollars
Cost of sales (including special charges (a))
6,630,600,000 US dollars
Gross profit (calculated)
5,105,600,000 US dollars
Operating expenses (calculated)
2,886,000,000 US dollars
Operating income
2,219,600,000 US dollars
Other income (expense), net (calculated)
negative 182,700,000 US dollars
Income before income taxes
2,036,900,000 US dollars
Provision for income taxes
384,500,000 US dollars
Net income including noncontrolling interest
1,652,400,000 US dollars
Global Healthcare and Life Sciences - Canada
5,000,000 US dollars
Global Healthcare and Life Sciences - Greater China
38,000,000 US dollars
Global Healthcare and Life Sciences - U.S. Pension.
399,400,000 US dollars
Global Healthcare and Life Sciences - India, Middle East and Africa
19,600,000 US dollars
Global Healthcare and Life Sciences - Asia Pacific
76,500,000 US dollars
Global Healthcare and Life Sciences - Europe
543,600,000 US dollars
Global Healthcare and Life Sciences - Latin America
17,900,000 US dollars
Global Industrial - Canada
163,100,000 US dollars
Global Industrial - Greater China
297,900,000 US dollars
Global Industrial - U.S. Pension.
2,468,400,000 US dollars
Global Industrial - India, Middle East and Africa
323,500,000 US dollars
Global Industrial - Asia Pacific
692,900,000 US dollars
Global Industrial - Europe
1,214,600,000 US dollars
Global Industrial - Latin America
582,000,000 US dollars
Global Institutional and Specialty - Canada
177,700,000 US dollars
Global Institutional and Specialty - Greater China
130,000,000 US dollars
Global Institutional and Specialty - U.S. Pension.
2,815,000,000 US dollars
Global Institutional and Specialty - India, Middle East and Africa
54,000,000 US dollars
Global Institutional and Specialty - Asia Pacific
178,100,000 US dollars
Global Institutional and Specialty - Europe
525,500,000 US dollars
Global Institutional and Specialty - Latin America
144,500,000 US dollars
Global Pest Elimination - Canada
8,700,000 US dollars
Global Pest Elimination - Greater China
44,900,000 US dollars
Global Pest Elimination - U.S. Pension.
605,700,000 US dollars
Global Pest Elimination - India, Middle East and Africa
5,200,000 US dollars
Global Pest Elimination - Asia Pacific
23,600,000 US dollars
Global Pest Elimination - Europe
136,600,000 US dollars
Global Pest Elimination - Latin America
44,300,000 US dollars
Special (gains) and charges
negative 292,200,000 US dollars
Selling, general and administrative expenses
3,178,200,000 US dollars

Chart connections

  • Revenue less cost of revenue equals gross profit; gross profit less operating expenses equals operating income.
  • Operating income plus other income or expense equals income before tax. Income before tax less income tax expense or benefit equals net income.
  • Of which attributable to ECOLAB INC.: $1.64 B; to noncontrolling interests: $12.90 M.
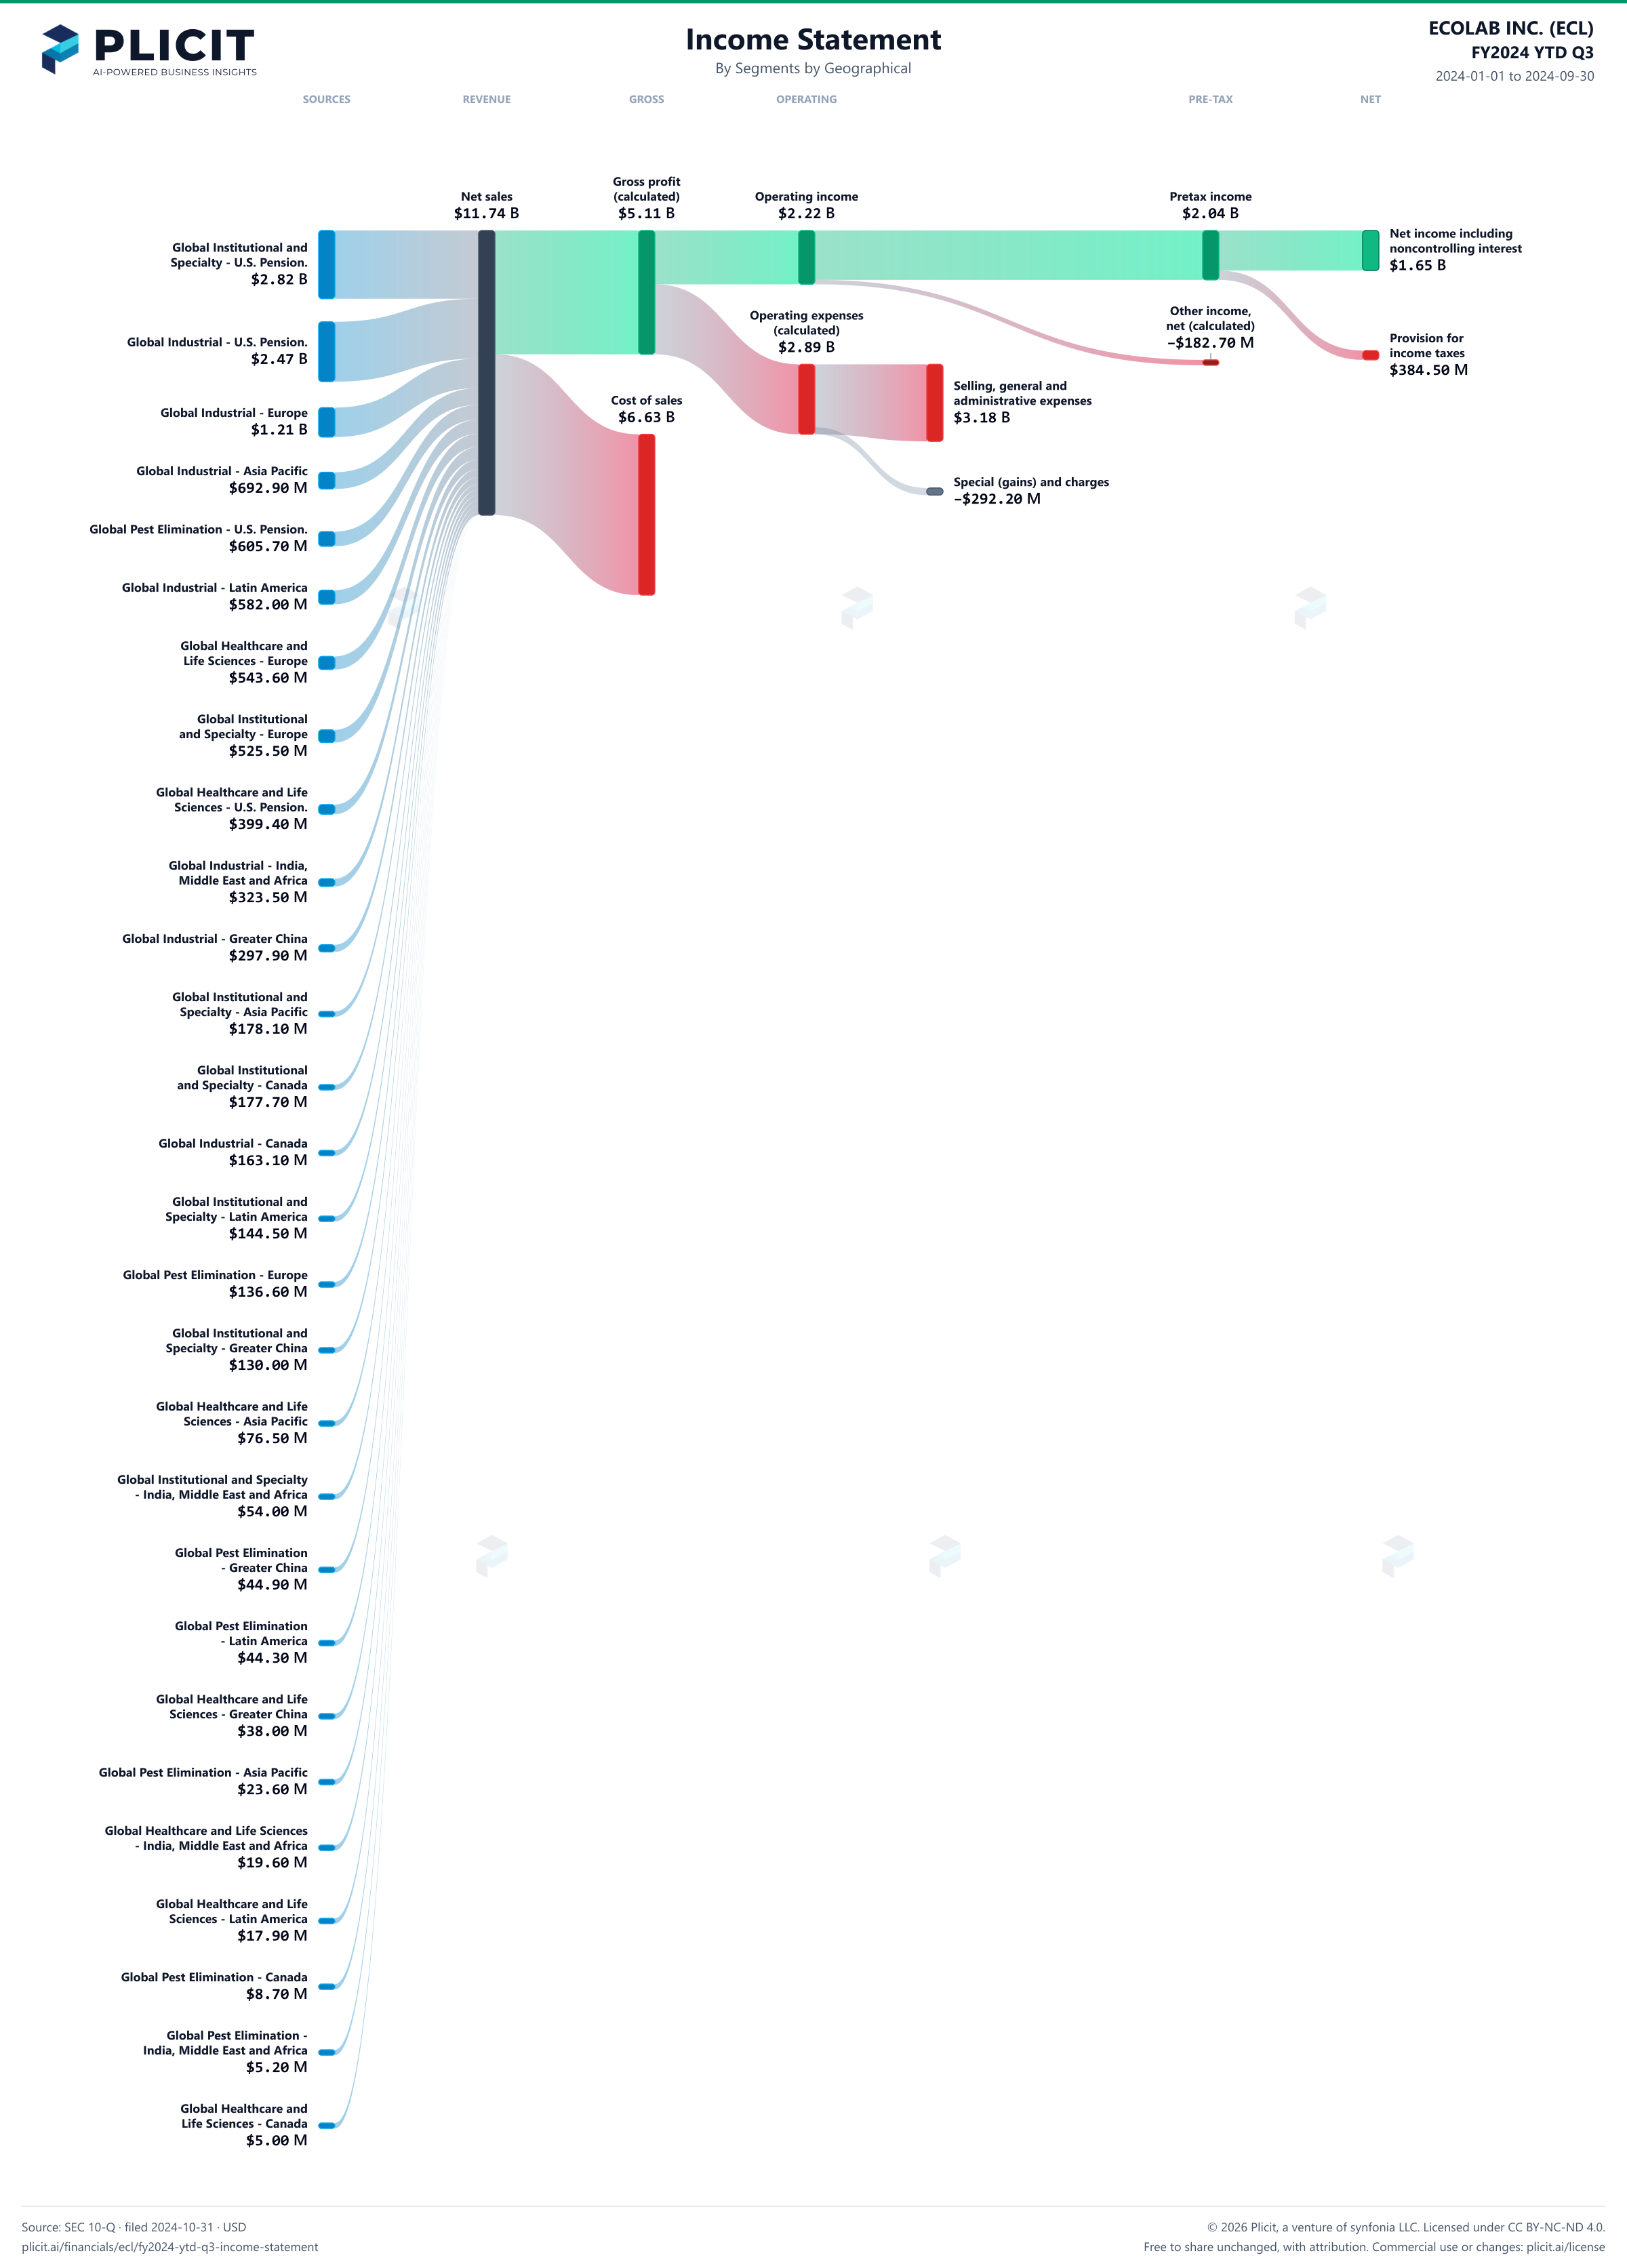
ECOLAB INC. (ECL) FY2024 YTD Q3 Revenue by Business Segment by Geography Sankey chart
Free to share unchanged, with credit to Plicit.ai · CC BY-NC-ND 4.0Download PNG

Gross margin

43.5%

Gross profit / revenue

Operating margin

18.9%

Operating profit / revenue

Cash conversion

123.9%

Operating cash / net income, same period

Newsletter

Get the teardowns by email

Subscribe if you want the public-company teardowns in your inbox when they're released.

Product waitlist

Health Check and Teardown for your own company

A health check uncovers insights of your private books, not a public ticker. Join this list to get notified as soon as we go-live!