
Fidelity National Information Services, Inc. (FIS) FY2026 YTD Q2 P&L / Income Statement

Revenue by Product and Service by Timing of Transfer

2026-01-01 to 2026-06-30

Swipe to see the full flow
Fidelity National Information Services, Inc. (FIS) FY2026 YTD Q2 P&L / Income StatementIncome statement for 2026-01-01 through 2026-06-30. View: Product and Service by Timing of Transfer of Good or Service. Revenue uses this breakdown; costs and expenses retain the consolidated categories.SOURCESREVENUEGROSSOPERATINGPRE-TAXNETTransaction processing and services - RecurringSoftware maintenance - RecurringProfessional services - Non-recurringSoftware license - Non-recurringOther non-recurring - Non-recurringOther recurring - RecurringRevenueGross profitCost of revenueOperating incomeOperating costs, net of other operating income (calculated)Selling, general, and administrative expensesAsset impairmentsOther operating (income) expense, net (including related-party transactions of $28 and $56 for the three- and six-month periods ended June 30, 2025, respectively)Earnings (loss) before income taxes and equity method investment earnings (loss)Other income (expense), net (calculated)Net earnings (loss)Provision (benefit) for income taxesEquity method investment earnings (loss), net of taxEquity method investment earnings (loss), net of taxEquity methodinvestment earnings(loss), net of tax$2.21 BNet earnings (loss)Net earnings (loss)$2.60 BRevenueRevenue$6.67 BGross profitGross profit$2.28 BOperating incomeOperating income$929.00 MEarnings (loss) before income taxes and equity method investment earnings (loss)Pretax income$555.00 MOperating costs, net of other operating income (calculated)Operating costs,net (calculated)$1.35 BTransaction processing and services - RecurringTransaction processingand services - Recurring$4.74 BSelling, general, and administrative expensesSelling, general, andadministrative expenses$1.29 BOther income (expense), net (calculated)Other income,net (calculated)−$374.00 MCost of revenueCost of revenue$4.39 BProvision (benefit) for income taxesProvision (benefit)for income taxes$170.00 MAsset impairmentsAsset impairments$104.00 MSoftware maintenance - RecurringSoftware maintenance - Recurring$547.00 MOther operating (income) expense, net (including related-party transactions of $28 and $56 for the three- and six-month periods ended June 30, 2025, respectively)Other operating(income) expense, net−$41.00 MProfessional services - Non-recurringProfessional services - Non-recurring$475.00 MSoftware license - Non-recurringSoftware license - Non-recurring$383.00 MOther non-recurring - Non-recurringOther non-recurring - Non-recurring$290.00 MOther recurring - RecurringOther recurring - Recurring$239.00 M
Chart details

Fidelity National Information Services, Inc. (FIS) FY2026 YTD Q2 P&L / Income Statement

Income statement for 2026-01-01 through 2026-06-30. View: Product and Service by Timing of Transfer of Good or Service. Revenue uses this breakdown; costs and expenses retain the consolidated categories.

Revenue
6,671,000,000 US dollars
Cost of revenue
4,390,000,000 US dollars
Gross profit
2,281,000,000 US dollars
Operating costs, net of other operating income (calculated)
1,352,000,000 US dollars
Operating income
929,000,000 US dollars
Other income (expense), net (calculated)
negative 374,000,000 US dollars
Earnings (loss) before income taxes and equity method investment earnings (loss)
555,000,000 US dollars
Provision (benefit) for income taxes
170,000,000 US dollars
Net earnings (loss)
2,599,000,000 US dollars
Other non-recurring - Non-recurring
290,000,000 US dollars
Professional services - Non-recurring
475,000,000 US dollars
Other recurring - Recurring
239,000,000 US dollars
Software license - Non-recurring
383,000,000 US dollars
Software maintenance - Recurring
547,000,000 US dollars
Transaction processing and services - Recurring
4,737,000,000 US dollars
Selling, general, and administrative expenses
1,289,000,000 US dollars
Asset impairments
104,000,000 US dollars
Other operating (income) expense, net (including related-party transactions of $28 and $56 for the three- and six-month periods ended June 30, 2025, respectively)
negative 41,000,000 US dollars
Equity method investment earnings (loss), net of tax
2,214,000,000 US dollars. Reported below-tax contribution to net income.

Chart connections

  • Revenue less cost of revenue equals gross profit; gross profit less operating expenses equals operating income.
  • Operating income plus other income or expense equals income before tax. Income before tax less income tax expense or benefit, plus the explicitly reported below-tax contributions, equals net income.
  • Of which attributable to Fidelity National Information Services, Inc.: $2.60 B; to noncontrolling interests: $1.00 M.
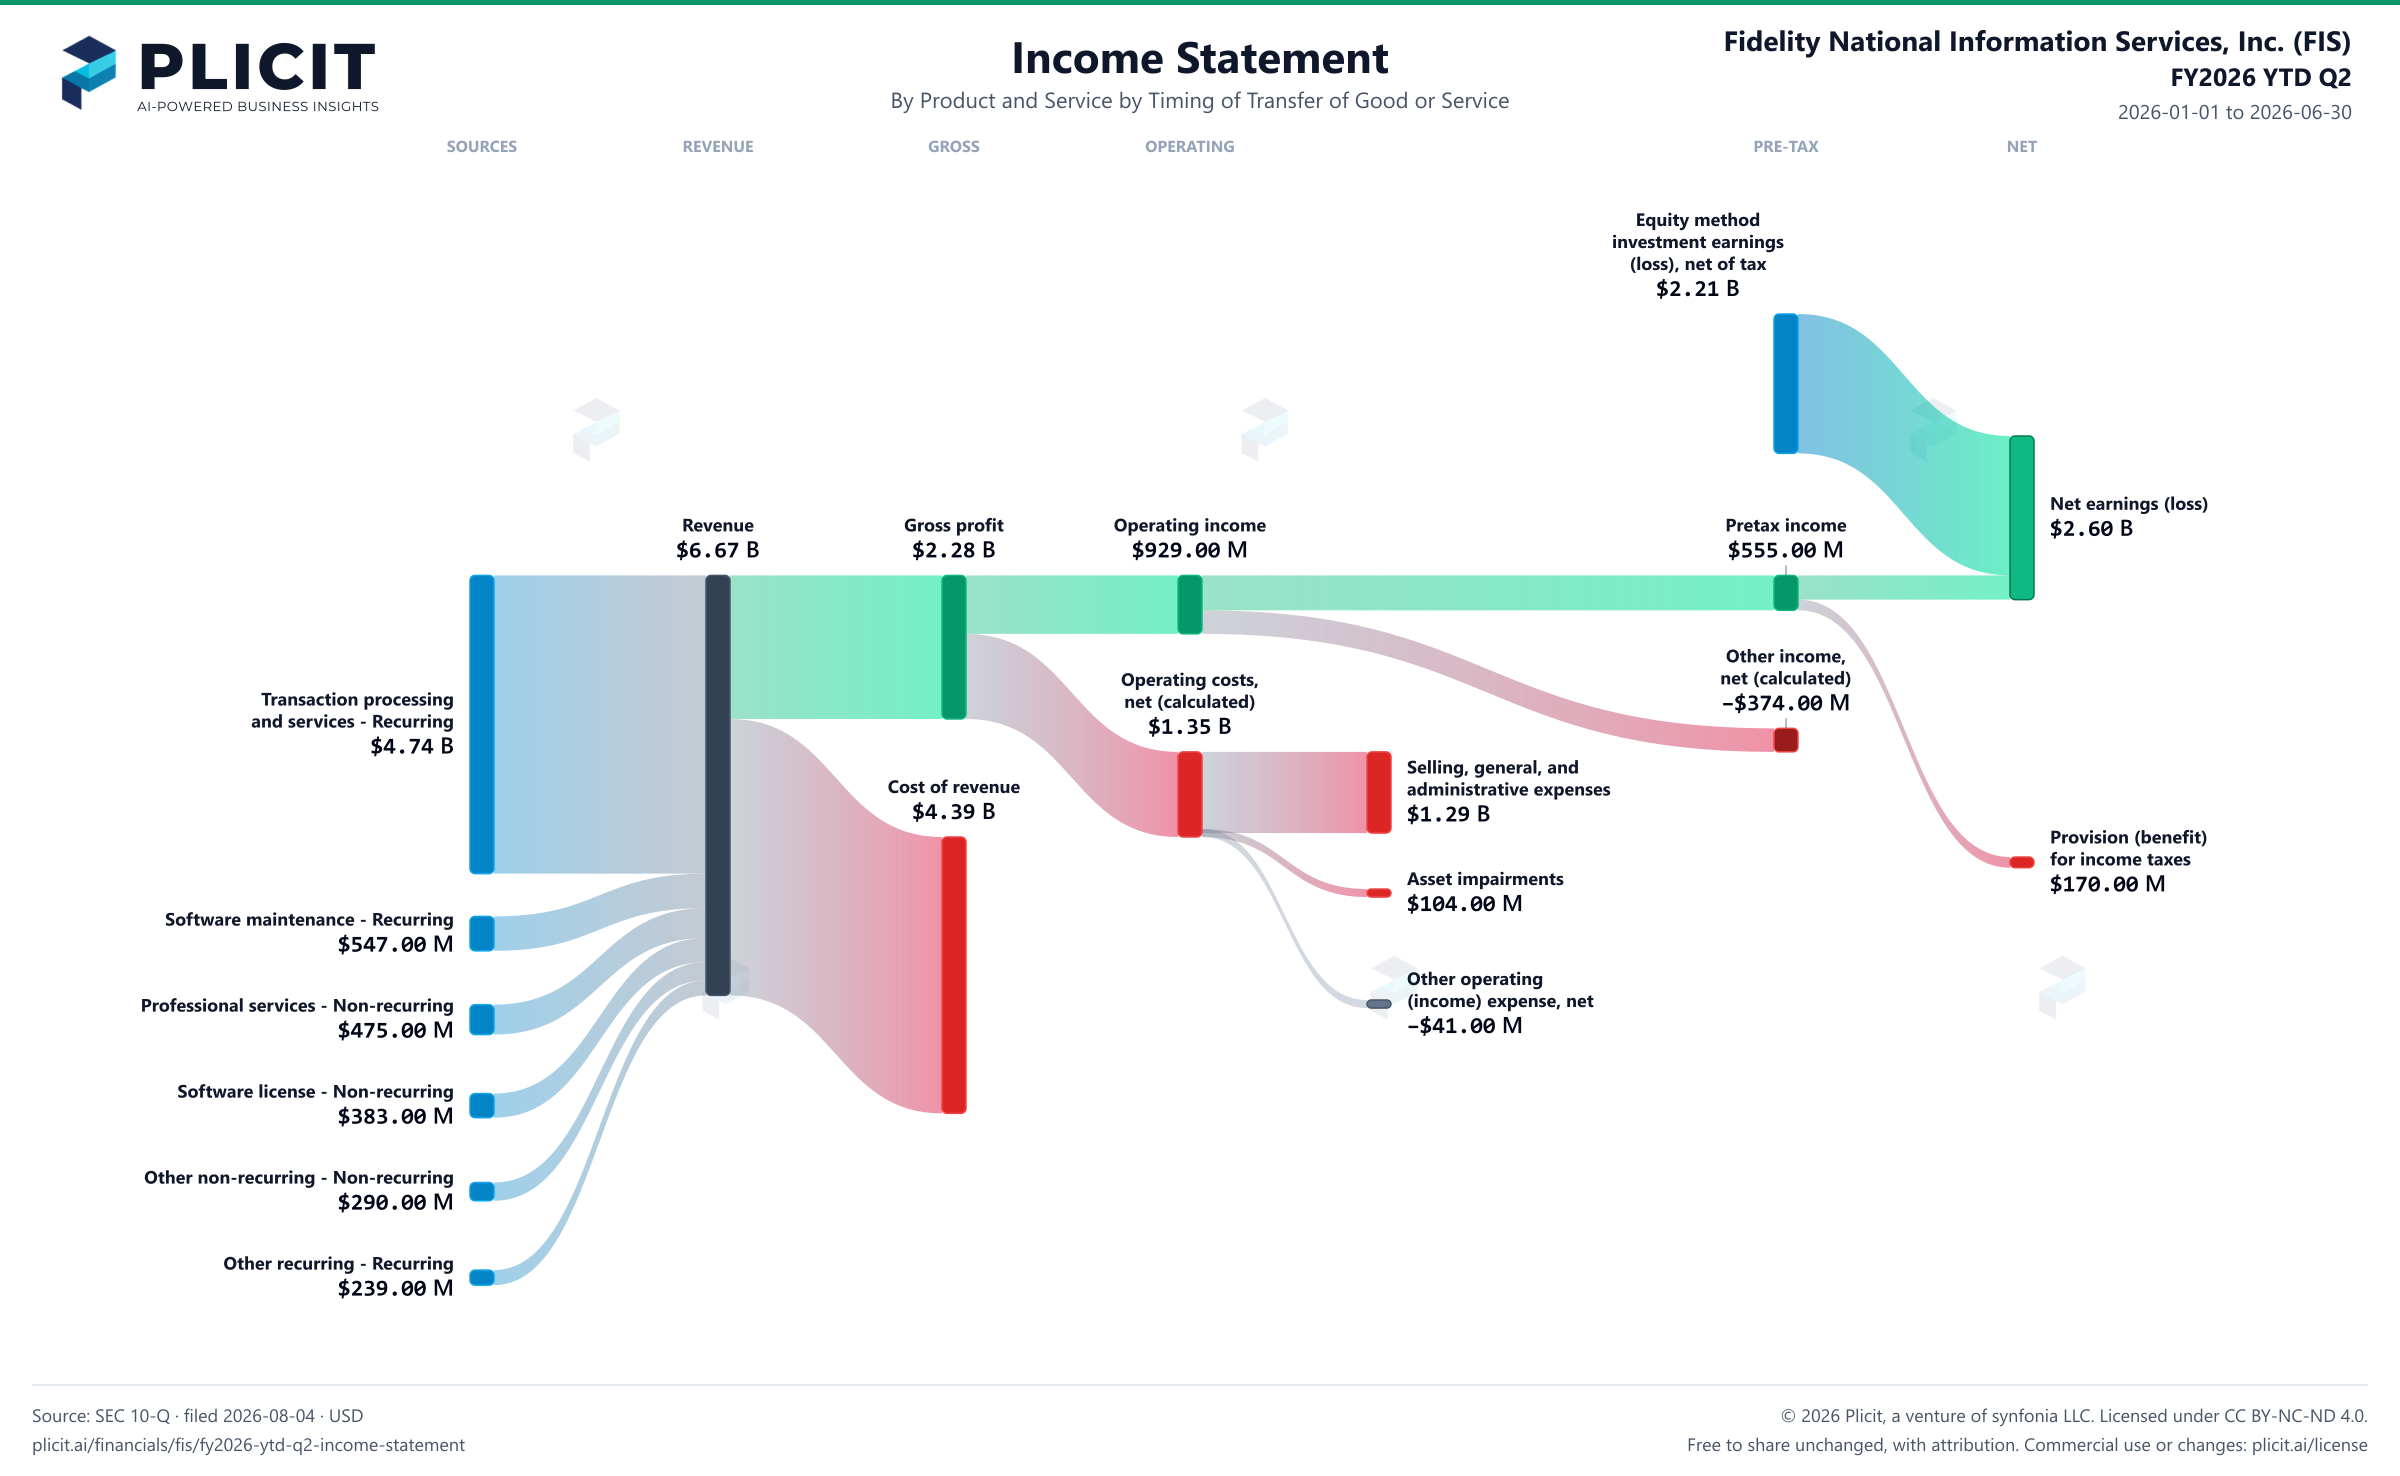
Fidelity National Information Services, Inc. (FIS) FY2026 YTD Q2 P&L / Income Statement Sankey chart, Product and service — Product and Service by Timing of Transfer of Good or Service view
Free to share unchanged, with credit to Plicit.ai · CC BY-NC-ND 4.0Download PNG

Gross margin

34.2%

Gross profit / revenue

Operating margin

13.9%

Operating profit / revenue

Cash conversion

46.4%

Operating cash / net income, same period

Newsletter

Get the teardowns by email

Subscribe if you want the public-company teardowns in your inbox when they're released.

Product waitlist

Health Check and Teardown for your own company

A health check uncovers insights of your private books, not a public ticker. Join this list to get notified as soon as we go-live!