
GENERAL DYNAMICS CORPORATION (GD) FY2024 YTD Q3 P&L / Income Statement

Revenue by Business Segment by Product and Service

2024-01-01 to 2024-09-29

Swipe to see the full flow
GENERAL DYNAMICS CORPORATION (GD) FY2024 YTD Q3 P&L / Income StatementIncome statement for 2024-01-01 through 2024-09-29. View: Segments by Product and Service. Revenue uses this breakdown; costs and expenses retain the consolidated categories.SOURCESREVENUEGROSSOPERATINGPRE-TAXNETMarine Systems - Nuclear-powered submarinesTechnologies - Information technology (IT) servicesAerospace - Aircraft manufacturingCombat Systems - Military vehiclesTechnologies - C5ISR* solutionsAerospace - Aircraft servicesCombat Systems - Weapons systems, armament and munitionsMarine Systems - Surface shipsMarine Systems - Repair and other servicesCombat Systems - Engineering and other servicesTotal revenueGross profit (calculated)Cost of revenue (calculated)Cost of salesOperating earningsOperating expenses (calculated)General and administrative (G&A)Earnings before income taxOther income (expense), net (calculated)Net earningsProvision for income tax, netGross profit (calculated)Gross profit(calculated)$5.28 BEarnings before income taxEarnings beforeincome tax$3.17 BTotal revenueTotal revenue$34.38 BOperating earningsOperating earnings$3.37 BNet earningsNet earnings$2.63 BMarine Systems - Nuclear-powered submarinesMarine Systems -Nuclear-powered submarines$7.50 BOperating expenses (calculated)Operating expenses(calculated)$1.91 BCost of revenue (calculated)Cost of revenue(calculated)$29.10 BProvision for income tax, netProvision forincome tax, net$538.00 MTechnologies - Information technology (IT) servicesTechnologies - Informationtechnology (IT) services$6.56 BGeneral and administrative (G&A)General and administrative (G&A)$1.91 BOther income (expense), net (calculated)Other income,net (calculated)−$201.00 MAerospace - Aircraft manufacturingAerospace - Aircraft manufacturing$5.01 BCombat Systems - Military vehiclesCombat Systems - Military vehicles$3.85 BTechnologies - C5ISR* solutionsTechnologies - C5ISR* solutions$3.33 BCost of salesCost of sales$29.10 BAerospace - Aircraft servicesAerospace - Aircraft services$2.49 BCombat Systems - Weapons systems, armament and munitionsCombat Systems - Weaponssystems, armament and munitions$2.03 BMarine Systems - Surface shipsMarine Systems - Surface ships$2.02 BMarine Systems - Repair and other servicesMarine Systems - Repairand other services$864.00 MCombat Systems - Engineering and other servicesCombat Systems - Engineeringand other services$719.00 M
Chart details

GENERAL DYNAMICS CORPORATION (GD) FY2024 YTD Q3 P&L / Income Statement

Income statement for 2024-01-01 through 2024-09-29. View: Segments by Product and Service. Revenue uses this breakdown; costs and expenses retain the consolidated categories.

Total revenue
34,378,000,000 US dollars
Cost of revenue (calculated)
29,099,000,000 US dollars
Gross profit (calculated)
5,279,000,000 US dollars
Operating expenses (calculated)
1,906,000,000 US dollars
Operating earnings
3,373,000,000 US dollars
Other income (expense), net (calculated)
negative 201,000,000 US dollars
Earnings before income tax
3,172,000,000 US dollars
Provision for income tax, net
538,000,000 US dollars
Net earnings
2,634,000,000 US dollars
Aerospace - Aircraft manufacturing
5,014,000,000 US dollars
Aerospace - Aircraft services
2,492,000,000 US dollars
Combat Systems - Engineering and other services
719,000,000 US dollars
Combat Systems - Military vehicles
3,850,000,000 US dollars
Combat Systems - Weapons systems, armament and munitions
2,033,000,000 US dollars
Marine Systems - Nuclear-powered submarines
7,496,000,000 US dollars
Marine Systems - Repair and other services
864,000,000 US dollars
Marine Systems - Surface ships
2,023,000,000 US dollars
Technologies - C5ISR* solutions
3,331,000,000 US dollars
Technologies - Information technology (IT) services
6,556,000,000 US dollars
Cost of sales
29,099,000,000 US dollars
General and administrative (G&A)
1,906,000,000 US dollars

Chart connections

  • Revenue less cost of revenue equals gross profit; gross profit less operating expenses equals operating income.
  • Operating income plus other income or expense equals income before tax. Income before tax less income tax expense or benefit equals net income.
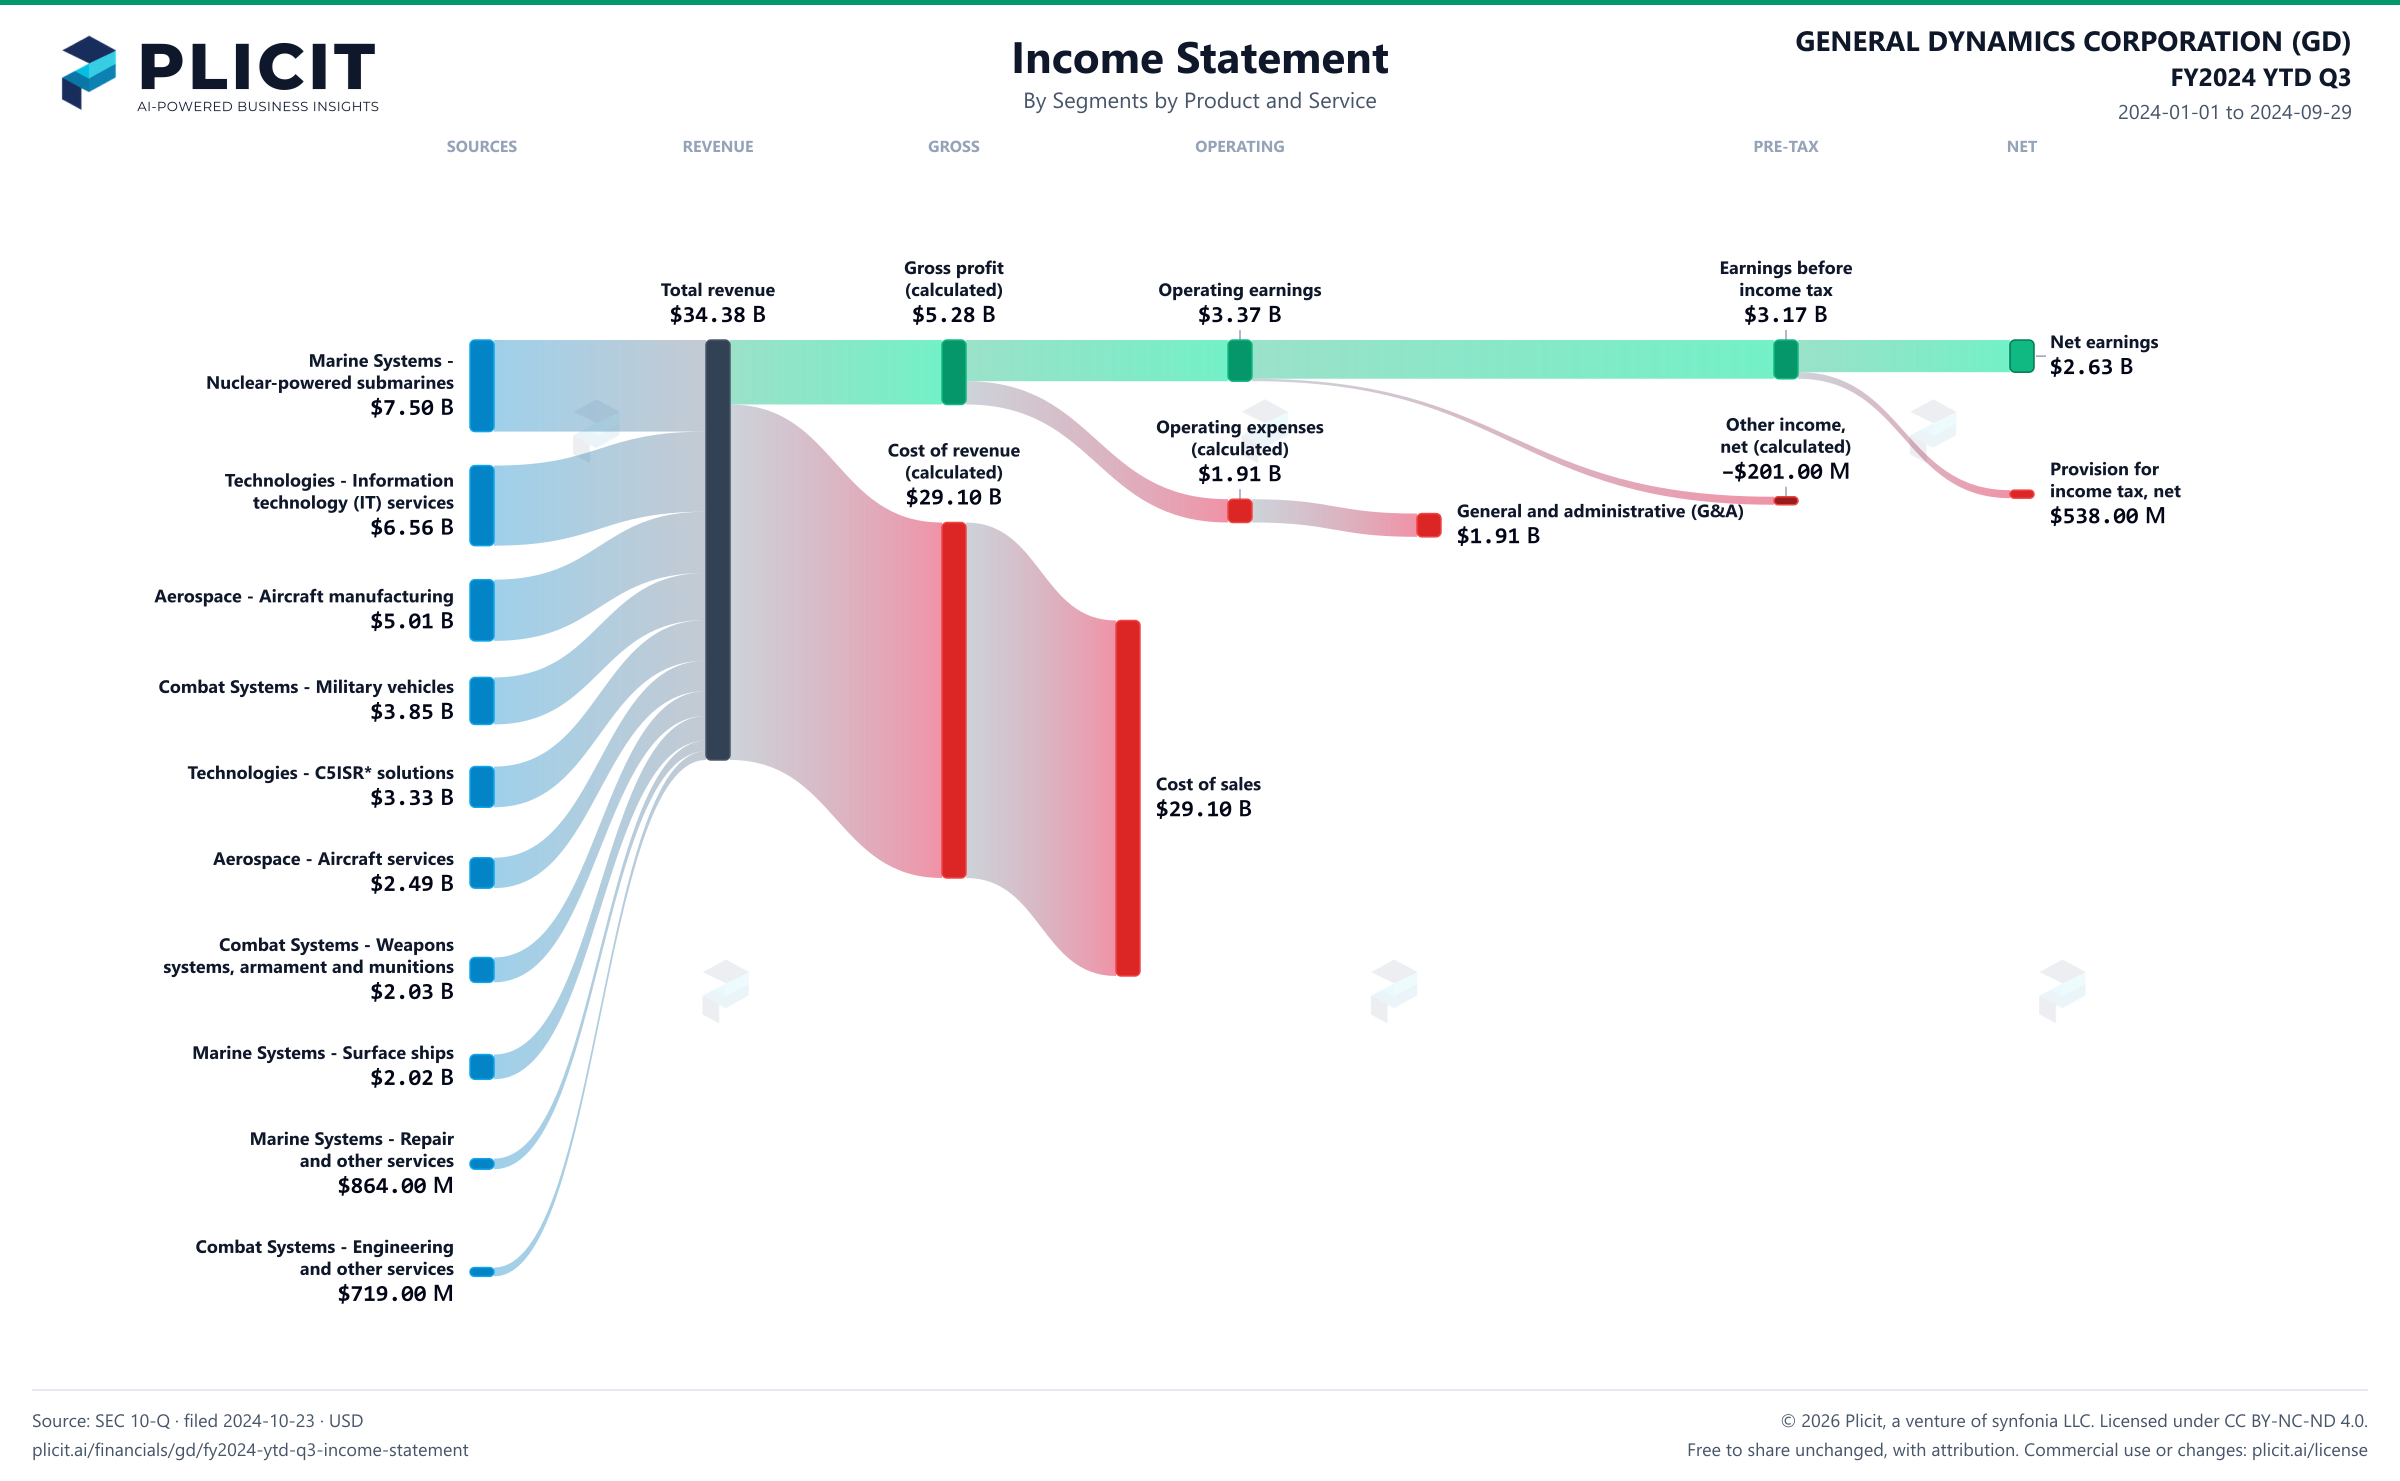
GENERAL DYNAMICS CORPORATION (GD) FY2024 YTD Q3 Revenue by Business Segment by Product and Service Sankey chart
Free to share unchanged, with credit to Plicit.ai · CC BY-NC-ND 4.0Download PNG

Gross margin

15.4%

Gross profit / revenue

Operating margin

9.8%

Operating profit / revenue

Cash conversion

74.1%

Operating cash / net income, same period

Newsletter

Get the teardowns by email

Subscribe if you want the public-company teardowns in your inbox when they're released.

Product waitlist

Health Check and Teardown for your own company

A health check uncovers insights of your private books, not a public ticker. Join this list to get notified as soon as we go-live!