
HNI Corporation (HNI) FY2026 YTD Q2 Statement of Cash Flows
2026-01-04 to 2026-07-04
Statement of Cash Flows
2026-01-04 to 2026-07-04
Swipe to see the full flow
Chart details
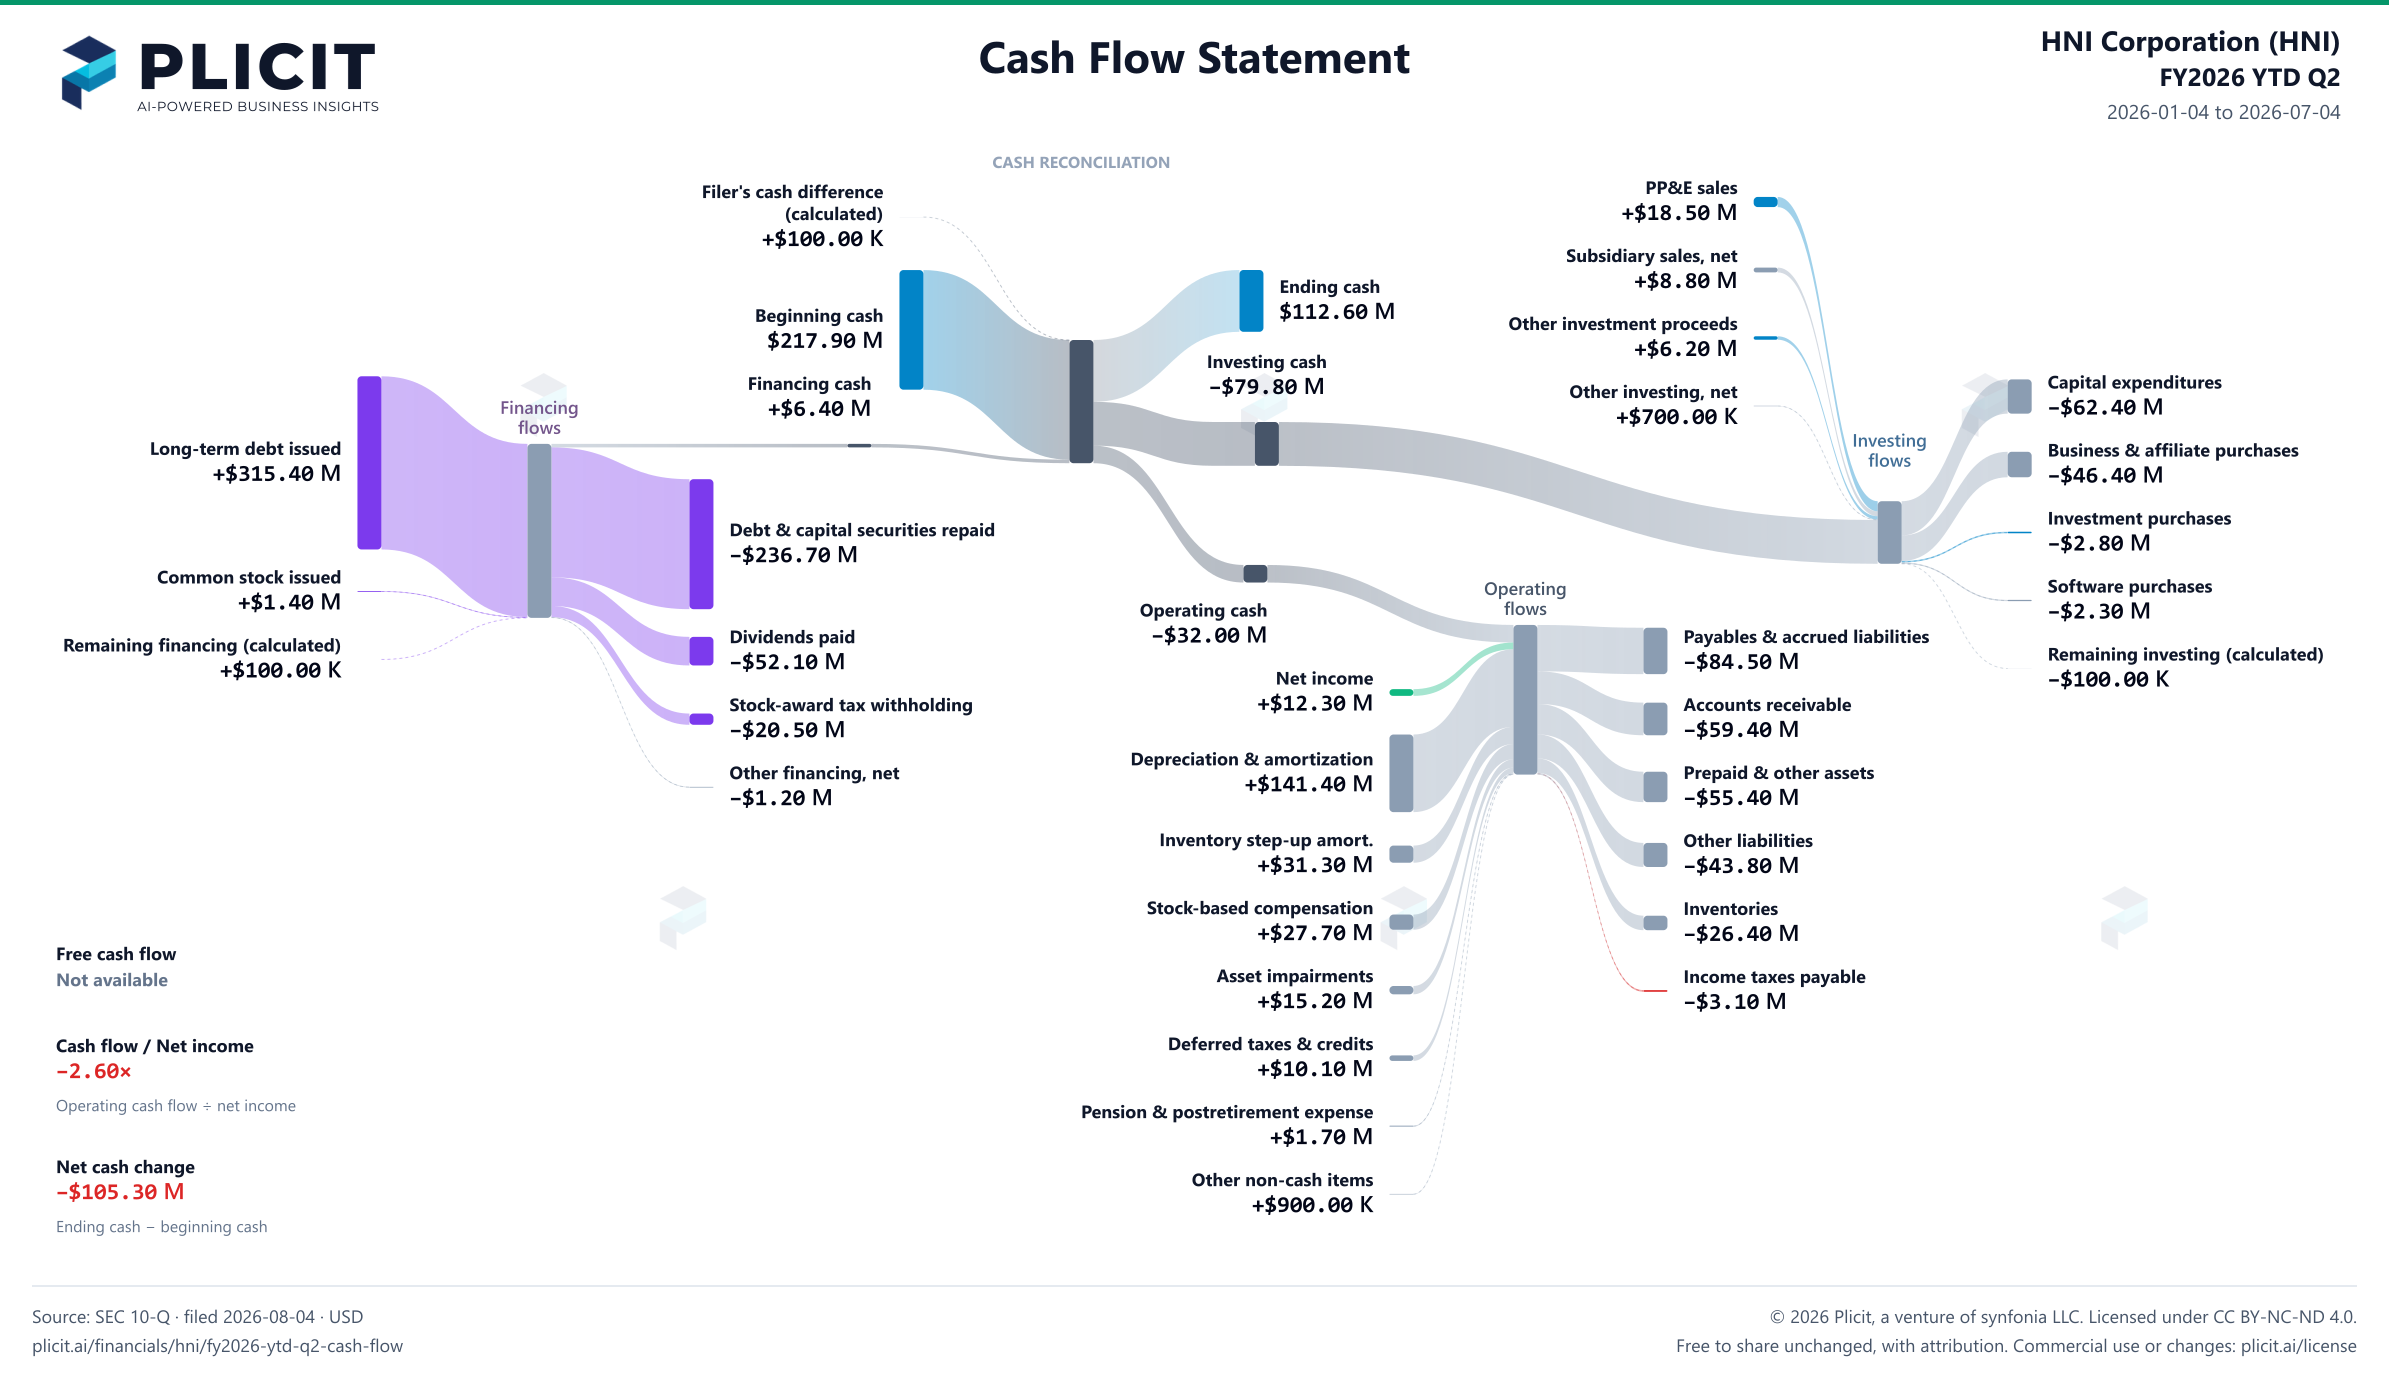
HNI Corporation cash flow reconciliation, Jan 4, 2026 through Jul 4, 2026
Cash flows for Jan 4, 2026 through Jul 4, 2026. Cash basis: Cash, cash equivalents, and restricted cash. Beginning cash: Jan 3, 2026. Ending cash: Jul 4, 2026. Beginning and ending cash are dated balances. Positive cash flows add cash; negative cash flows reduce it.
- Beginning cash on Jan 3, 2026
- 217,900,000 US dollars. Beginning cash: Cash, cash equivalents, and restricted cash
- Operating activities
- negative 32,000,000 US dollars. Net cash used.
- Net income
- 12,300,000 US dollars
- Depreciation and amortization
- 141,400,000 US dollars
- Other post-retirement and post-employment benefits
- 1,700,000 US dollars
- Stock-based compensation
- 27,700,000 US dollars
- Deferred income taxes
- 10,100,000 US dollars
- Asset impairment charges
- 15,200,000 US dollars
- Other – net
- 900,000 US dollars
- Receivables
- negative 59,400,000 US dollars
- Inventories
- negative 26,400,000 US dollars
- Prepaid Expenses and Other
- negative 55,400,000 US dollars
- Accounts payable and accrued expenses
- negative 84,500,000 US dollars
- Income taxes payable
- negative 3,100,000 US dollars
- Increase (decrease) in other liabilities
- negative 43,800,000 US dollars
- Inventory step-up
- 31,300,000 US dollars
- Loss on sale of subsidiary
- 0 US dollars
- Investing activities
- negative 79,800,000 US dollars. Net cash used. The remaining amount is calculated by subtracting the other displayed items from the investing total. The filing's tagged investing lines do not add up to the investing total; this is the difference. It may combine inflows and outflows.
- Capital expenditures
- negative 62,400,000 US dollars
- Capitalized software
- negative 2,300,000 US dollars
- Purchase of investments
- negative 2,800,000 US dollars
- Sales or maturities of investments
- 6,200,000 US dollars
- Investment in Unconsolidated Affiliate Purchases
- negative 46,400,000 US dollars
- Proceeds from sale of property, plant, and equipment
- 18,500,000 US dollars
- Net proceeds from sale of subsidiary
- 8,800,000 US dollars
- Net proceeds from sale of subsidiary
- 0 US dollars
- Other
- 700,000 US dollars
- Remaining investing cash flows, net (calculated)
- negative 100,000 US dollars
- Financing activities
- 6,400,000 US dollars. Net cash provided. The remaining amount is calculated by subtracting the other displayed items from the financing total. The filing's tagged financing lines do not add up to the financing total; this is the difference. It may combine inflows and outflows.
- Payments of debt
- negative 236,700,000 US dollars
- Proceeds from debt
- 315,400,000 US dollars
- Dividends paid
- negative 52,100,000 US dollars
- Purchase of HNI Corporation common stock
- 0 US dollars
- Proceeds from sales of HNI Corporation common stock
- 1,400,000 US dollars
- Withholding related to net share settlements of equity based awards
- negative 20,500,000 US dollars
- Other – net
- negative 1,200,000 US dollars
- Remaining financing cash flows, net (calculated)
- 100,000 US dollars
- Operating adjustment reconciliation
- 272,600,000 US dollars. Intermediate calculation joining the operating reconciliation branches. Its gross amount includes any portion of net income routed through this junction. It is not an additional cash source or use.
- financing displayed reconciliation
- 316,900,000 US dollars. Intermediate calculation joining the displayed items and the calculated net remainder. It does not establish gross cash receipts or payments and is not an additional cash flow.
- investing displayed reconciliation
- 114,000,000 US dollars. Intermediate calculation joining the displayed items and the calculated net remainder. It does not establish gross cash receipts or payments and is not an additional cash flow.
- Exchange-rate effect
- 0 US dollars
- Difference in the filed cash totals (calculated)
- 100,000 US dollars. Into cash; drawn as the small gray flow above beginning cash.
- Ending cash on Jul 4, 2026
- 112,600,000 US dollars. Ending cash: Cash, cash equivalents, and restricted cash
- Cash sources and uses
- 224,400,000 US dollars. Opening cash plus net sources, equal to net uses plus ending cash.
- Net cash change
- negative 105,300,000 US dollars. Ending cash minus beginning cash.
- Cash flow / Net income
- −2.60×. Operating cash flow divided by reconciliation net income for the same period. Black from 0.90× through 1.10×; green above 1.10×; red below 0.90×. Color uses the unrounded ratio.
Chart connections
- Beginning cash plus operating, investing and financing cash flows plus the exchange-rate effect equals ending cash. Negative amounts reduce cash.
- Financing contributions meet at a reconciliation junction before connecting to the net cash total.
- Investing contributions meet at a reconciliation junction before connecting to the net cash total.
- Operating reconciliation adjustments are not all independent cash receipts.
- Net income or operating cash is negative. The full signed reconciliation is retained: losses remain deductions, and any negative operating-cash total enters the junction from the cash pool. No positive direct-income connection is implied.
- Each activity has one net cash bar connected to the shared cash pool. Positive activity totals enter the pool; negative activity totals leave the pool to fund that activity's net payments. The central pool does not assign a particular funding source to a particular payment.
- The intermediate calculation bars include both sides of the displayed activity breakdowns; they are not additional cash flows.
- The filer's reported cash figures differ by $100.00 K: its operating, investing and financing totals and exchange-rate effect do not add up to its reported net change in cash. The chart shows the difference as its own calculated flow; no reported amount has been adjusted.
- The filer's reported cash figures differ by $100.00 K: its operating, investing and financing totals and exchange-rate effect do not add up to its reported net change in cash. The chart shows the difference as its own calculated flow; no reported amount has been adjusted.
Free to share unchanged, with credit to Plicit.ai · CC BY-NC-ND 4.0Download PNG
Product waitlist
Health Check and Teardown for your own company
A health check uncovers insights of your private books, not a public ticker. Join this list to get notified as soon as we go-live!