
HELMERICH & PAYNE, INC. (HP) FY2026 YTD Q3 P&L / Income Statement
2025-10-01 to 2026-06-30
Revenue by Business Segment (2)
2025-10-01 to 2026-06-30
Swipe to see the full flow
Chart details
HELMERICH & PAYNE, INC. (HP) FY2026 YTD Q3 P&L / Income Statement
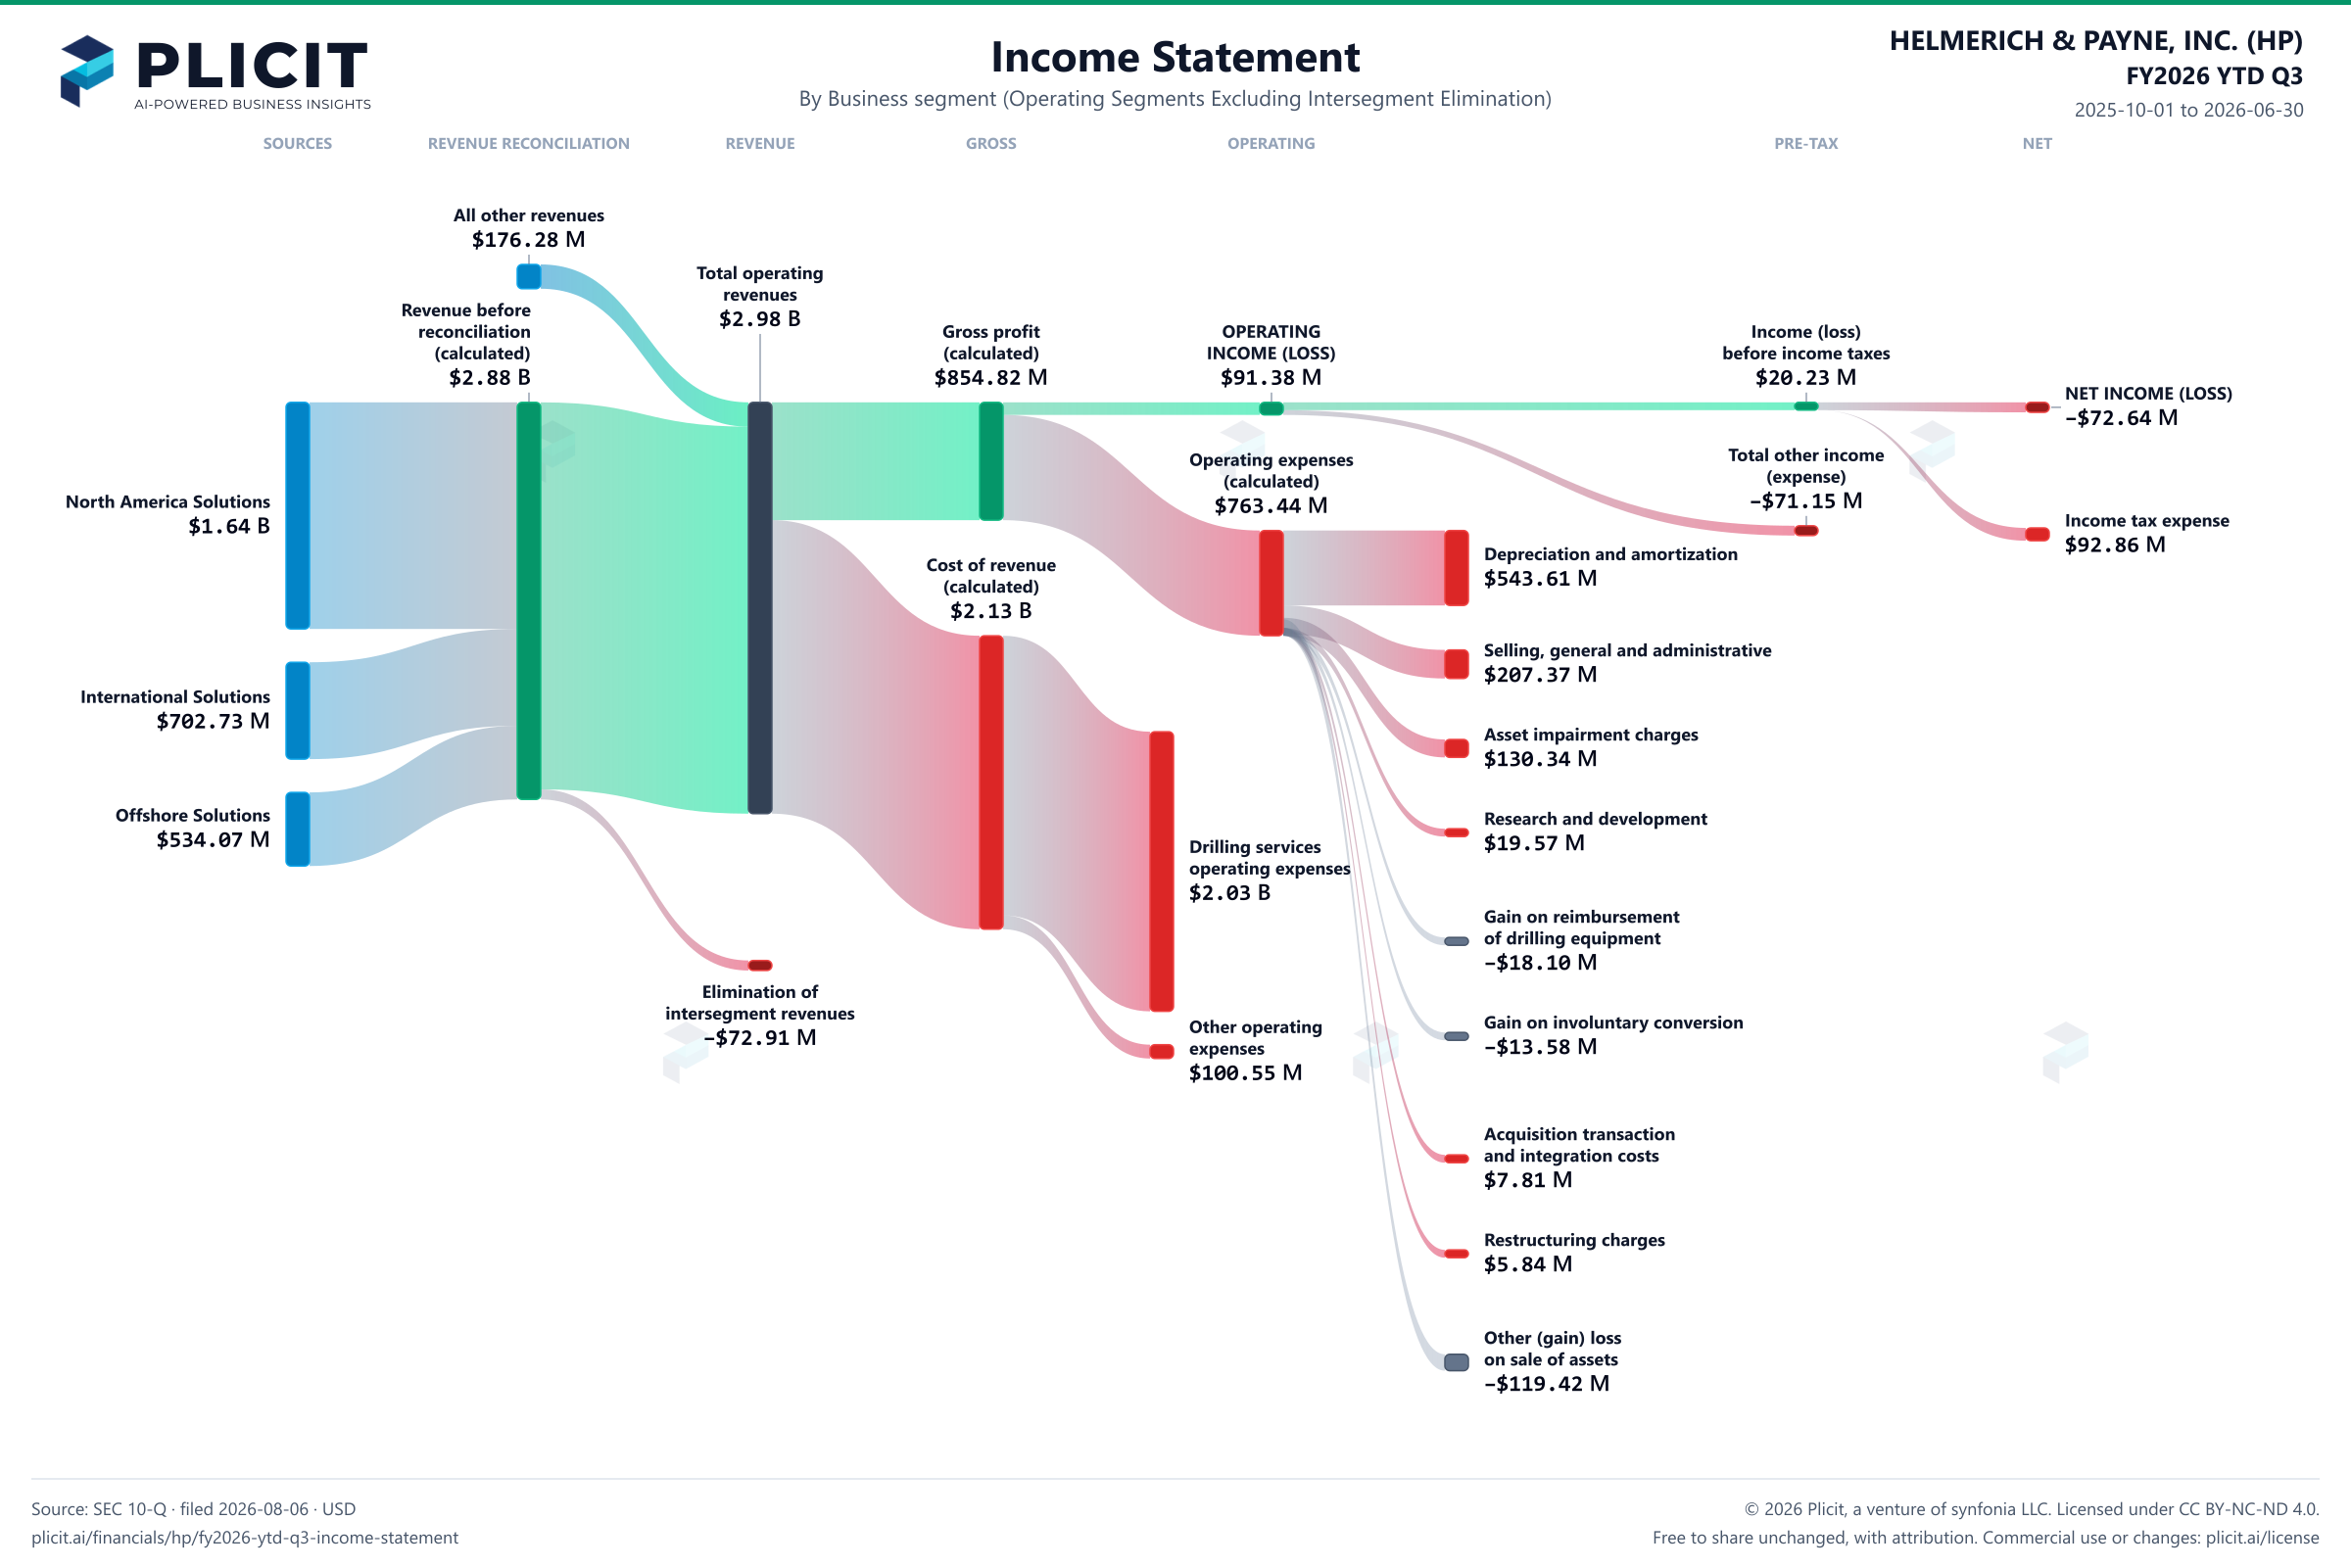
Income statement for 2025-10-01 through 2026-06-30. View: Business segment (Operating Segments Excluding Intersegment Elimination). Revenue uses this breakdown; costs and expenses retain the consolidated categories.
- Total operating revenues
- 2,984,244,000 US dollars
- Cost of revenue (calculated)
- 2,129,421,000 US dollars
- Gross profit (calculated)
- 854,823,000 US dollars
- Operating expenses (calculated)
- 763,443,000 US dollars
- OPERATING INCOME (LOSS)
- 91,380,000 US dollars
- Total other income (expense)
- negative 71,154,000 US dollars
- Income (loss) before income taxes
- 20,226,000 US dollars
- Income tax expense
- 92,861,000 US dollars
- NET INCOME (LOSS)
- negative 72,635,000 US dollars
- International Solutions
- 702,726,000 US dollars
- North America Solutions
- 1,644,085,000 US dollars
- Offshore Solutions
- 534,069,000 US dollars
- Drilling services operating expenses, excluding depreciation and amortization
- 2,028,873,000 US dollars
- Other operating expenses
- 100,548,000 US dollars
- Research and development
- 19,571,000 US dollars
- Other (gain) loss on sale of assets
- negative 119,423,000 US dollars
- Depreciation and amortization
- 543,613,000 US dollars
- Acquisition transaction and integration costs
- 7,814,000 US dollars
- Gain on reimbursement of drilling equipment
- negative 18,099,000 US dollars
- Selling, general and administrative
- 207,373,000 US dollars
- Asset impairment charges
- 130,340,000 US dollars
- Restructuring charges
- 5,835,000 US dollars
- Gain on involuntary conversion
- negative 13,581,000 US dollars
- Revenue before reconciliation (calculated)
- 2,880,880,000 US dollars. Sum of the reported revenue categories before the separately reported reconciliation.
- Elimination of intersegment revenues
- negative 72,914,000 US dollars. Reported reconciliation to consolidated revenue.
- All other revenues
- 176,278,000 US dollars. Reported reconciliation to consolidated revenue.
- International Solutions costs (calculated)
- 906,567,000 US dollars. Segment revenue less segment operating income; it includes cost of revenue and operating expenses.
- North America Solutions costs (calculated)
- 1,355,295,000 US dollars. Segment revenue less segment operating income; it includes cost of revenue and operating expenses.
- Offshore Solutions costs (calculated)
- 486,817,000 US dollars. Segment revenue less segment operating income; it includes cost of revenue and operating expenses.
- Reconciling items (calculated)
- 144,185,000 US dollars. Segment revenue less segment operating income; it includes cost of revenue and operating expenses.
Chart connections
- Revenue less cost of revenue equals gross profit; gross profit less operating expenses equals operating income.
- Operating income plus other income or expense equals income before tax. Income before tax less income tax expense or benefit equals net income.
- Reported revenue categories plus the separately reported signed reconciliation equals consolidated revenue.
- Of which attributable to HELMERICH & PAYNE, INC.: −$79.63 M; to noncontrolling interests: $7.00 M.
Free to share unchanged, with credit to Plicit.ai · CC BY-NC-ND 4.0Download PNG
Gross margin
28.6%
Gross profit / revenue
Operating margin
3.1%
Operating profit / revenue
Product waitlist
Health Check and Teardown for your own company
A health check uncovers insights of your private books, not a public ticker. Join this list to get notified as soon as we go-live!