
Lineage, Inc. (LINE) FY2026 YTD Q2 P&L / Income Statement

Revenue by Business Segment by Product and Service

2026-01-01 to 2026-06-30

Swipe to see the full flow
Lineage, Inc. (LINE) FY2026 YTD Q2 P&L / Income StatementIncome statement for 2026-01-01 through 2026-06-30. View: Segments by Product and Service. Revenue uses this breakdown; costs and expenses retain the consolidated categories.SOURCESREVENUEGROSSOPERATINGPRE-TAXNETGlobal Warehousing - Warehousing operationsGlobal Integrated Solutions - TransportationGlobal Warehousing - Warehouse lease revenuesGlobal Integrated Solutions - Redistribution revenuesGlobal Warehousing - Managed servicesGlobal Integrated Solutions - Food salesGlobal Integrated Solutions - E-commerce and otherGlobal Integrated Solutions - Railcar lease revenuesGlobal Warehousing - OtherNet revenuesGross profit (calculated)Cost of operationsIncome from operationsOperating expenses (calculated)Depreciation expenseGeneral and administrative expenseAmortization expenseRestructuring, impairment, and (gain) loss on disposalsAcquisition, transaction, and other expenseNet income (loss) before income taxesTotal other income (expense), netNet income (loss)Income tax expense (benefit)Gross profit (calculated)Gross profit(calculated)$842.00 MNet income (loss) before income taxesNet income (loss)before income taxes−$80.00 MNet revenuesNet revenues$2.66 BIncome from operationsIncome from operations$90.00 MNet income (loss)Net income (loss)−$83.00 MOperating expenses (calculated)Operating expenses(calculated)$752.00 MIncome tax expense (benefit)Income taxexpense (benefit)$3.00 MGlobal Warehousing - Warehousing operationsGlobal Warehousing -Warehousing operations$1.73 BDepreciation expenseDepreciation expense$359.00 MCost of operationsCost of operations$1.82 BGeneral and administrative expenseGeneral andadministrative expense$279.00 MGlobal Integrated Solutions - TransportationGlobal IntegratedSolutions - Transportation$323.00 MAmortization expenseAmortization expense$111.00 MRestructuring, impairment, and (gain) loss on disposalsRestructuring, impairment,and (gain) loss on disposals−$1.00 MTotal other income (expense), netTotal other income(expense), net−$170.00 MGlobal Warehousing - Warehouse lease revenuesGlobal Warehousing -Warehouse lease revenues$145.00 MGlobal Integrated Solutions - Redistribution revenuesGlobal Integrated Solutions- Redistribution revenues$119.00 MAcquisition, transaction, and other expenseAcquisition, transaction,and other expense$4.00 MGlobal Warehousing - Managed servicesGlobal Warehousing- Managed services$107.00 MGlobal Integrated Solutions - Food salesGlobal IntegratedSolutions - Food sales$104.00 MGlobal Integrated Solutions - E-commerce and otherGlobal Integrated Solutions- E-commerce and other$82.00 MGlobal Integrated Solutions - Railcar lease revenuesGlobal Integrated Solutions- Railcar lease revenues$40.00 MGlobal Warehousing - OtherGlobal Warehousing - Other$7.00 M
Chart details

Lineage, Inc. (LINE) FY2026 YTD Q2 P&L / Income Statement

Income statement for 2026-01-01 through 2026-06-30. View: Segments by Product and Service. Revenue uses this breakdown; costs and expenses retain the consolidated categories.

Net revenues
2,658,000,000 US dollars
Cost of operations
1,816,000,000 US dollars
Gross profit (calculated)
842,000,000 US dollars
Operating expenses (calculated)
752,000,000 US dollars
Income from operations
90,000,000 US dollars
Total other income (expense), net
negative 170,000,000 US dollars
Net income (loss) before income taxes
negative 80,000,000 US dollars
Income tax expense (benefit)
3,000,000 US dollars
Net income (loss)
negative 83,000,000 US dollars
Global Integrated Solutions - E-commerce and other
82,000,000 US dollars
Global Integrated Solutions - Food sales
104,000,000 US dollars
Global Integrated Solutions - Railcar lease revenues
40,000,000 US dollars
Global Integrated Solutions - Redistribution revenues
119,000,000 US dollars
Global Integrated Solutions - Transportation
323,000,000 US dollars
Global Warehousing - Warehouse lease revenues
145,000,000 US dollars
Global Warehousing - Warehousing operations
1,731,000,000 US dollars
Global Warehousing - Managed services
107,000,000 US dollars
Global Warehousing - Other
7,000,000 US dollars
General and administrative expense
279,000,000 US dollars
Depreciation expense
359,000,000 US dollars
Amortization expense
111,000,000 US dollars
Acquisition, transaction, and other expense
4,000,000 US dollars
Restructuring, impairment, and (gain) loss on disposals
negative 1,000,000 US dollars

Chart connections

  • Revenue less cost of revenue equals gross profit; gross profit less operating expenses equals operating income.
  • Operating income plus other income or expense equals income before tax. Income before tax less income tax expense or benefit equals net income.
  • Of which attributable to Lineage, Inc.: −$75.00 M; to noncontrolling interests: −$8.00 M.
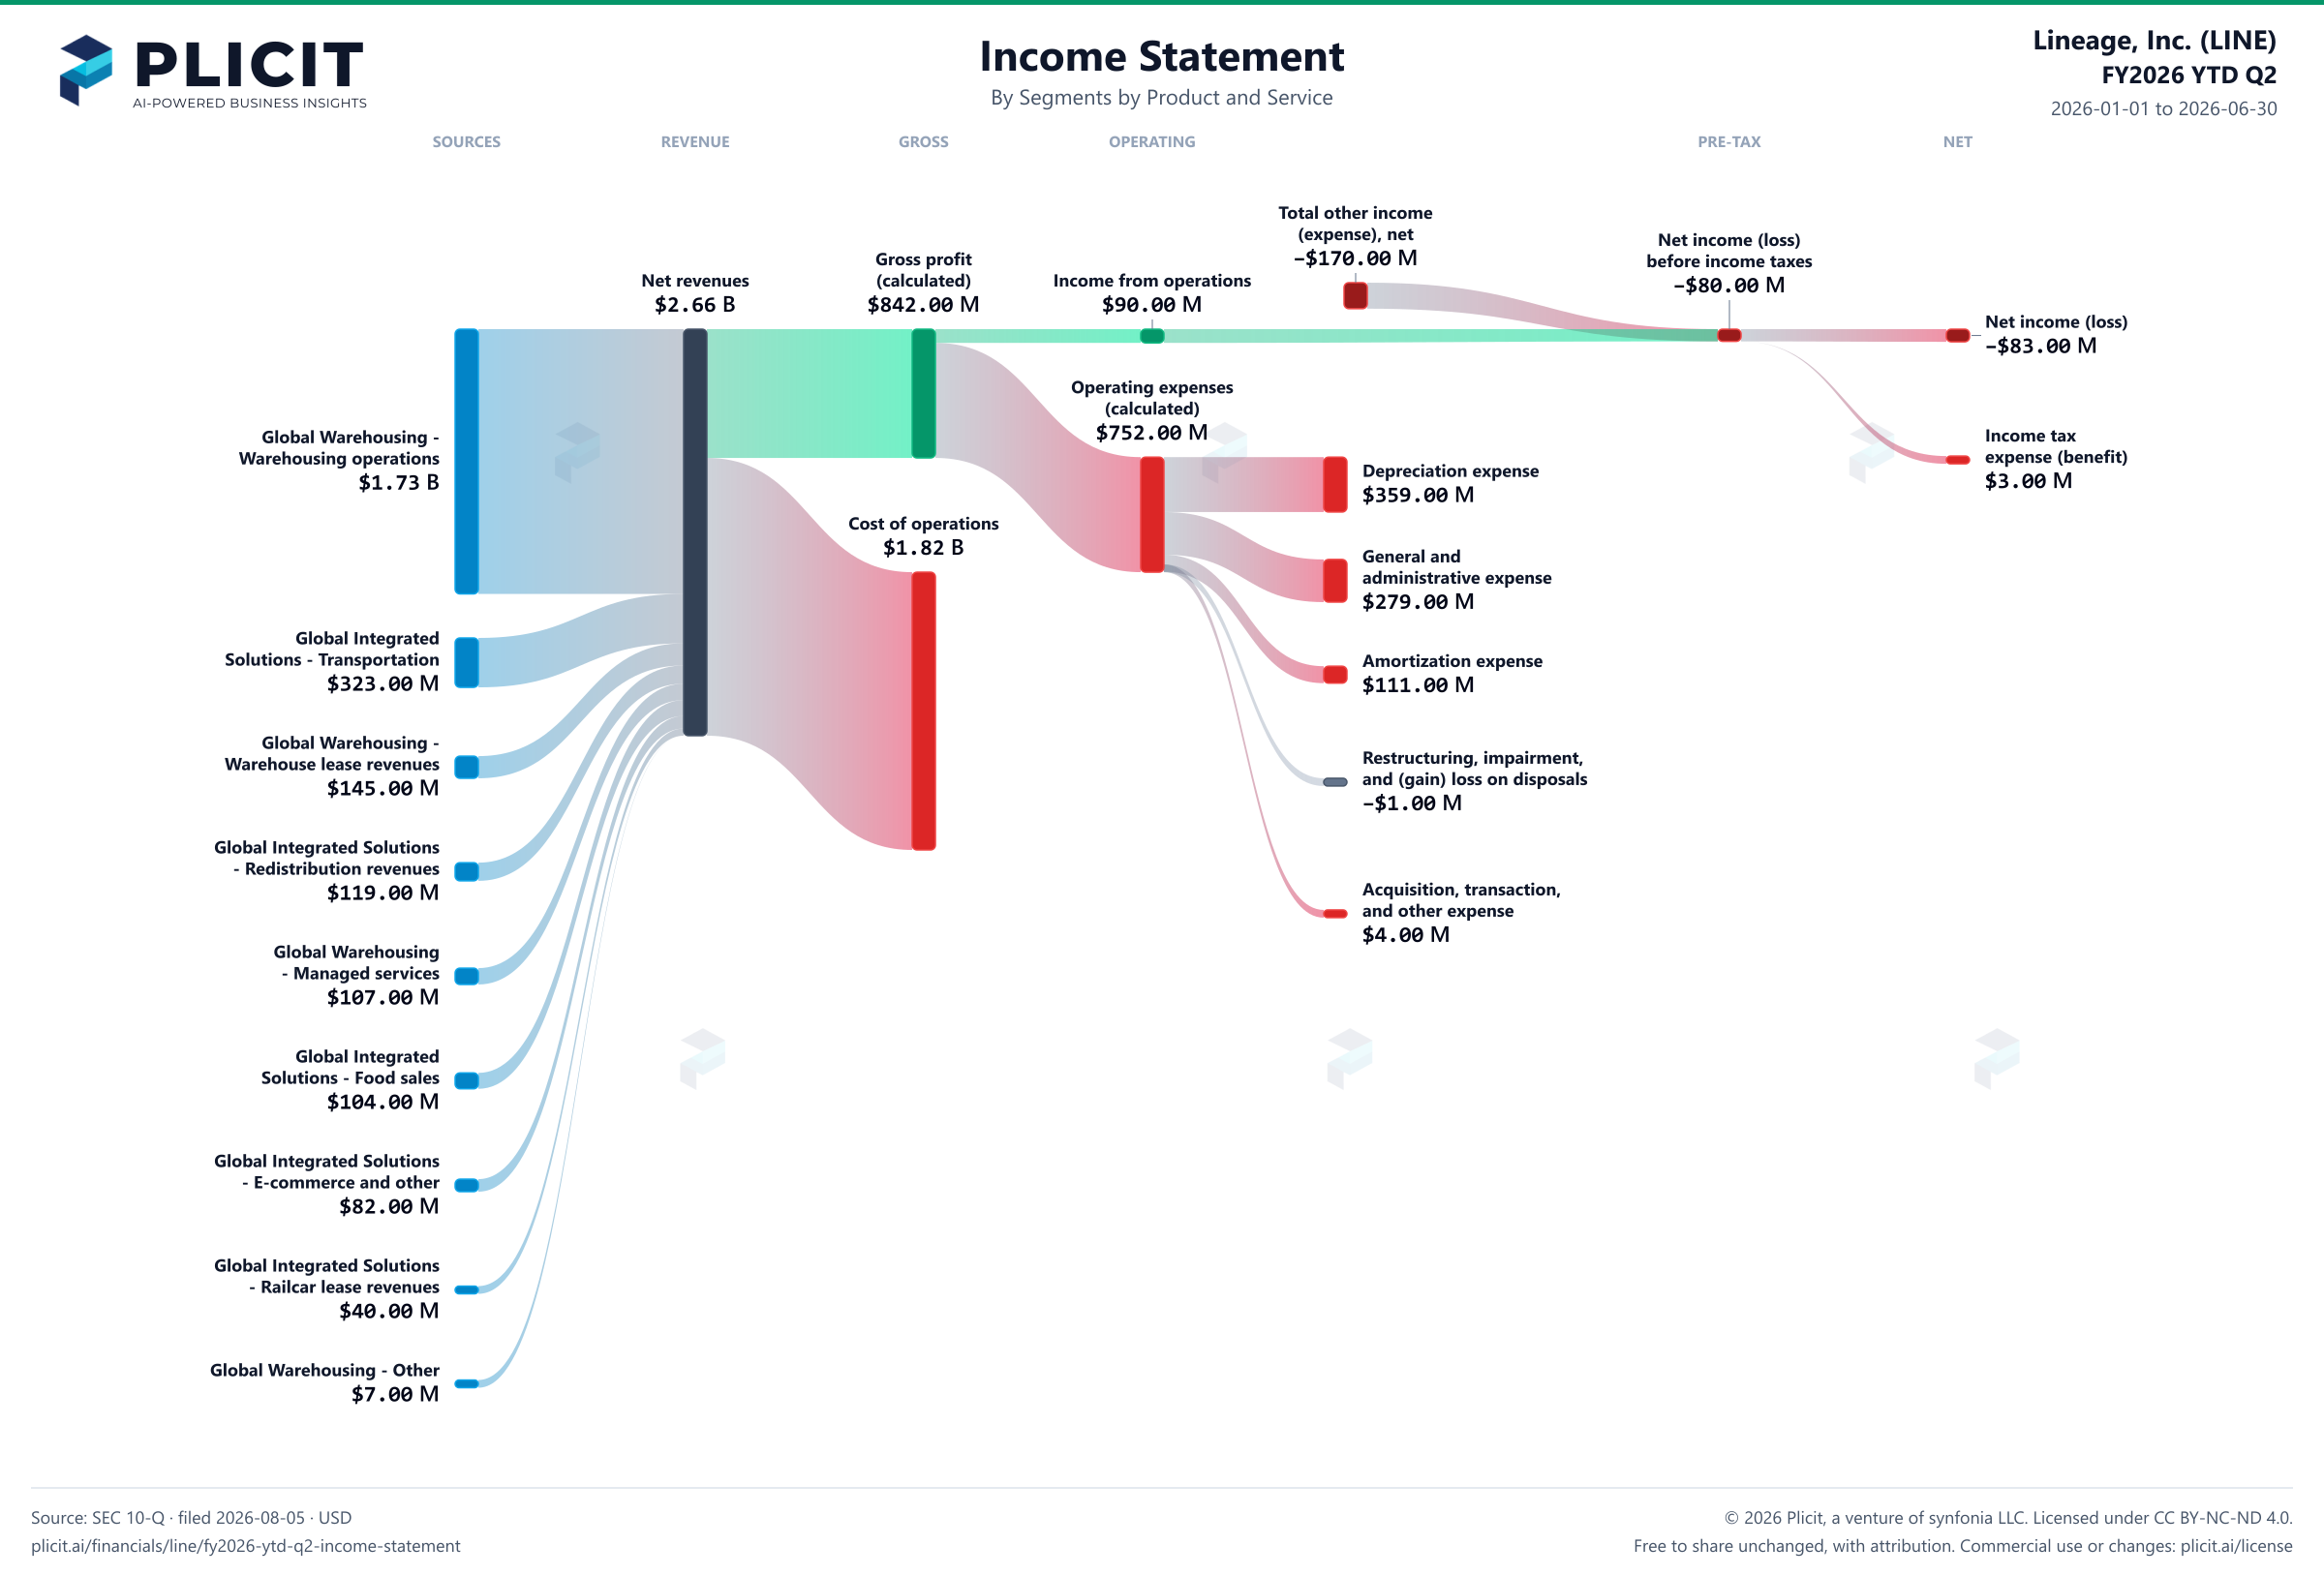
Lineage, Inc. (LINE) FY2026 YTD Q2 P&L / Income Statement Sankey chart, Segments by Product and Service view
Free to share unchanged, with credit to Plicit.ai · CC BY-NC-ND 4.0Download PNG

Gross margin

31.7%

Gross profit / revenue

Operating margin

3.4%

Operating profit / revenue

Newsletter

Get the teardowns by email

Subscribe if you want the public-company teardowns in your inbox when they're released.

Product waitlist

Health Check and Teardown for your own company

A health check uncovers insights of your private books, not a public ticker. Join this list to get notified as soon as we go-live!