
PPG INDUSTRIES INC (PPG) FY2026 YTD Q2 P&L / Income Statement

Revenue by Business Segment by Geography

2026-01-01 to 2026-06-30

Swipe to see the full flow
PPG INDUSTRIES INC (PPG) FY2026 YTD Q2 P&L / Income StatementIncome statement for 2026-01-01 through 2026-06-30. View: Segments by Geographical. Revenue uses this breakdown; costs and expenses retain the consolidated categories.SOURCESREVENUEGROSSOPERATINGPRE-TAXNETPerformance Coatings - United States and CanadaGlobal Architectural Coatings - EMEAIndustrial Coatings - United States and CanadaIndustrial Coatings - EMEAIndustrial Coatings - Asia PacificPerformance Coatings - EMEAGlobal Architectural Coatings - Latin AmericaPerformance Coatings - Asia PacificIndustrial Coatings - Latin AmericaGlobal Architectural Coatings - Asia PacificPerformance Coatings - Latin AmericaNet salesGross profit (calculated)Cost of sales, exclusive of depreciation and amortizationOperating profit (calculated)Operating expenses (calculated)Selling, general and administrativeResearch and development, netDepreciationAmortizationIncome before income taxesOther income (expense), net (calculated)Net income/(loss) attributable to the controlling and noncontrolling interestsIncome tax expenseLoss from discontinued operations, net of taxGross profit (calculated)Gross profit(calculated)$3.46 BOperating profit (calculated)Operating profit(calculated)$1.16 BNet salesNet sales$8.43 BIncome before income taxesPretax income$1.09 BNet income/(loss) attributable to the controlling and noncontrolling interestsNet income$825.00 MPerformance Coatings - United States and CanadaPerformance Coatings -United States and Canada$1.64 BOperating expenses (calculated)Operating expenses(calculated)$2.30 BGlobal Architectural Coatings - EMEAGlobal Architectural Coatings - EMEA$1.26 BIncome tax expenseIncome tax expense$259.00 MOther income (expense), net (calculated)Other income,net (calculated)−$75.00 MSelling, general and administrativeSelling, general and administrative$1.82 BIndustrial Coatings - United States and CanadaIndustrial Coatings -United States and Canada$1.14 BCost of sales, exclusive of depreciation and amortizationCost of sales$4.96 BLoss from discontinued operations, net of taxLoss from discontinuedoperations, net of tax−$2.00 MResearch and development, netResearch and development, net$220.00 MIndustrial Coatings - EMEAIndustrial Coatings - EMEA$968.00 MDepreciationDepreciation$213.00 MIndustrial Coatings - Asia PacificIndustrial Coatings - Asia Pacific$898.00 MAmortizationAmortization$53.00 MPerformance Coatings - EMEAPerformance Coatings - EMEA$740.00 MGlobal Architectural Coatings - Latin AmericaGlobal ArchitecturalCoatings - Latin America$696.00 MPerformance Coatings - Asia PacificPerformance Coatings - Asia Pacific$515.00 MIndustrial Coatings - Latin AmericaIndustrial Coatings - Latin America$404.00 MGlobal Architectural Coatings - Asia PacificGlobal ArchitecturalCoatings - Asia Pacific$105.00 MPerformance Coatings - Latin AmericaPerformance Coatings - Latin America$56.00 M
Chart details

PPG INDUSTRIES INC (PPG) FY2026 YTD Q2 P&L / Income Statement

Income statement for 2026-01-01 through 2026-06-30. View: Segments by Geographical. Revenue uses this breakdown; costs and expenses retain the consolidated categories.

Net sales
8,425,000,000 US dollars
Cost of sales, exclusive of depreciation and amortization
4,962,000,000 US dollars
Gross profit (calculated)
3,463,000,000 US dollars
Operating expenses (calculated)
2,302,000,000 US dollars
Operating profit (calculated)
1,161,000,000 US dollars
Other income (expense), net (calculated)
negative 75,000,000 US dollars
Income before income taxes
1,086,000,000 US dollars
Income tax expense
259,000,000 US dollars
Net income/(loss) attributable to the controlling and noncontrolling interests
825,000,000 US dollars
Global Architectural Coatings - Asia Pacific
105,000,000 US dollars
Global Architectural Coatings - Latin America
696,000,000 US dollars
Global Architectural Coatings - EMEA
1,262,000,000 US dollars
Industrial Coatings - Asia Pacific
898,000,000 US dollars
Industrial Coatings - Latin America
404,000,000 US dollars
Industrial Coatings - United States and Canada
1,139,000,000 US dollars
Industrial Coatings - EMEA
968,000,000 US dollars
Performance Coatings - Asia Pacific
515,000,000 US dollars
Performance Coatings - Latin America
56,000,000 US dollars
Performance Coatings - United States and Canada
1,642,000,000 US dollars
Performance Coatings - EMEA
740,000,000 US dollars
Selling, general and administrative
1,816,000,000 US dollars
Depreciation
213,000,000 US dollars
Amortization
53,000,000 US dollars
Research and development, net
220,000,000 US dollars
Loss from discontinued operations, net of tax
negative 2,000,000 US dollars. Reported below-tax contribution to net income.

Chart connections

  • Revenue less cost of revenue equals gross profit; gross profit less operating expenses equals operating income.
  • Operating income plus other income or expense equals income before tax. Income before tax less income tax expense or benefit, plus the explicitly reported below-tax contributions, equals net income.
  • Of which attributable to PPG INDUSTRIES INC: $819.00 M; to noncontrolling interests: $6.00 M.
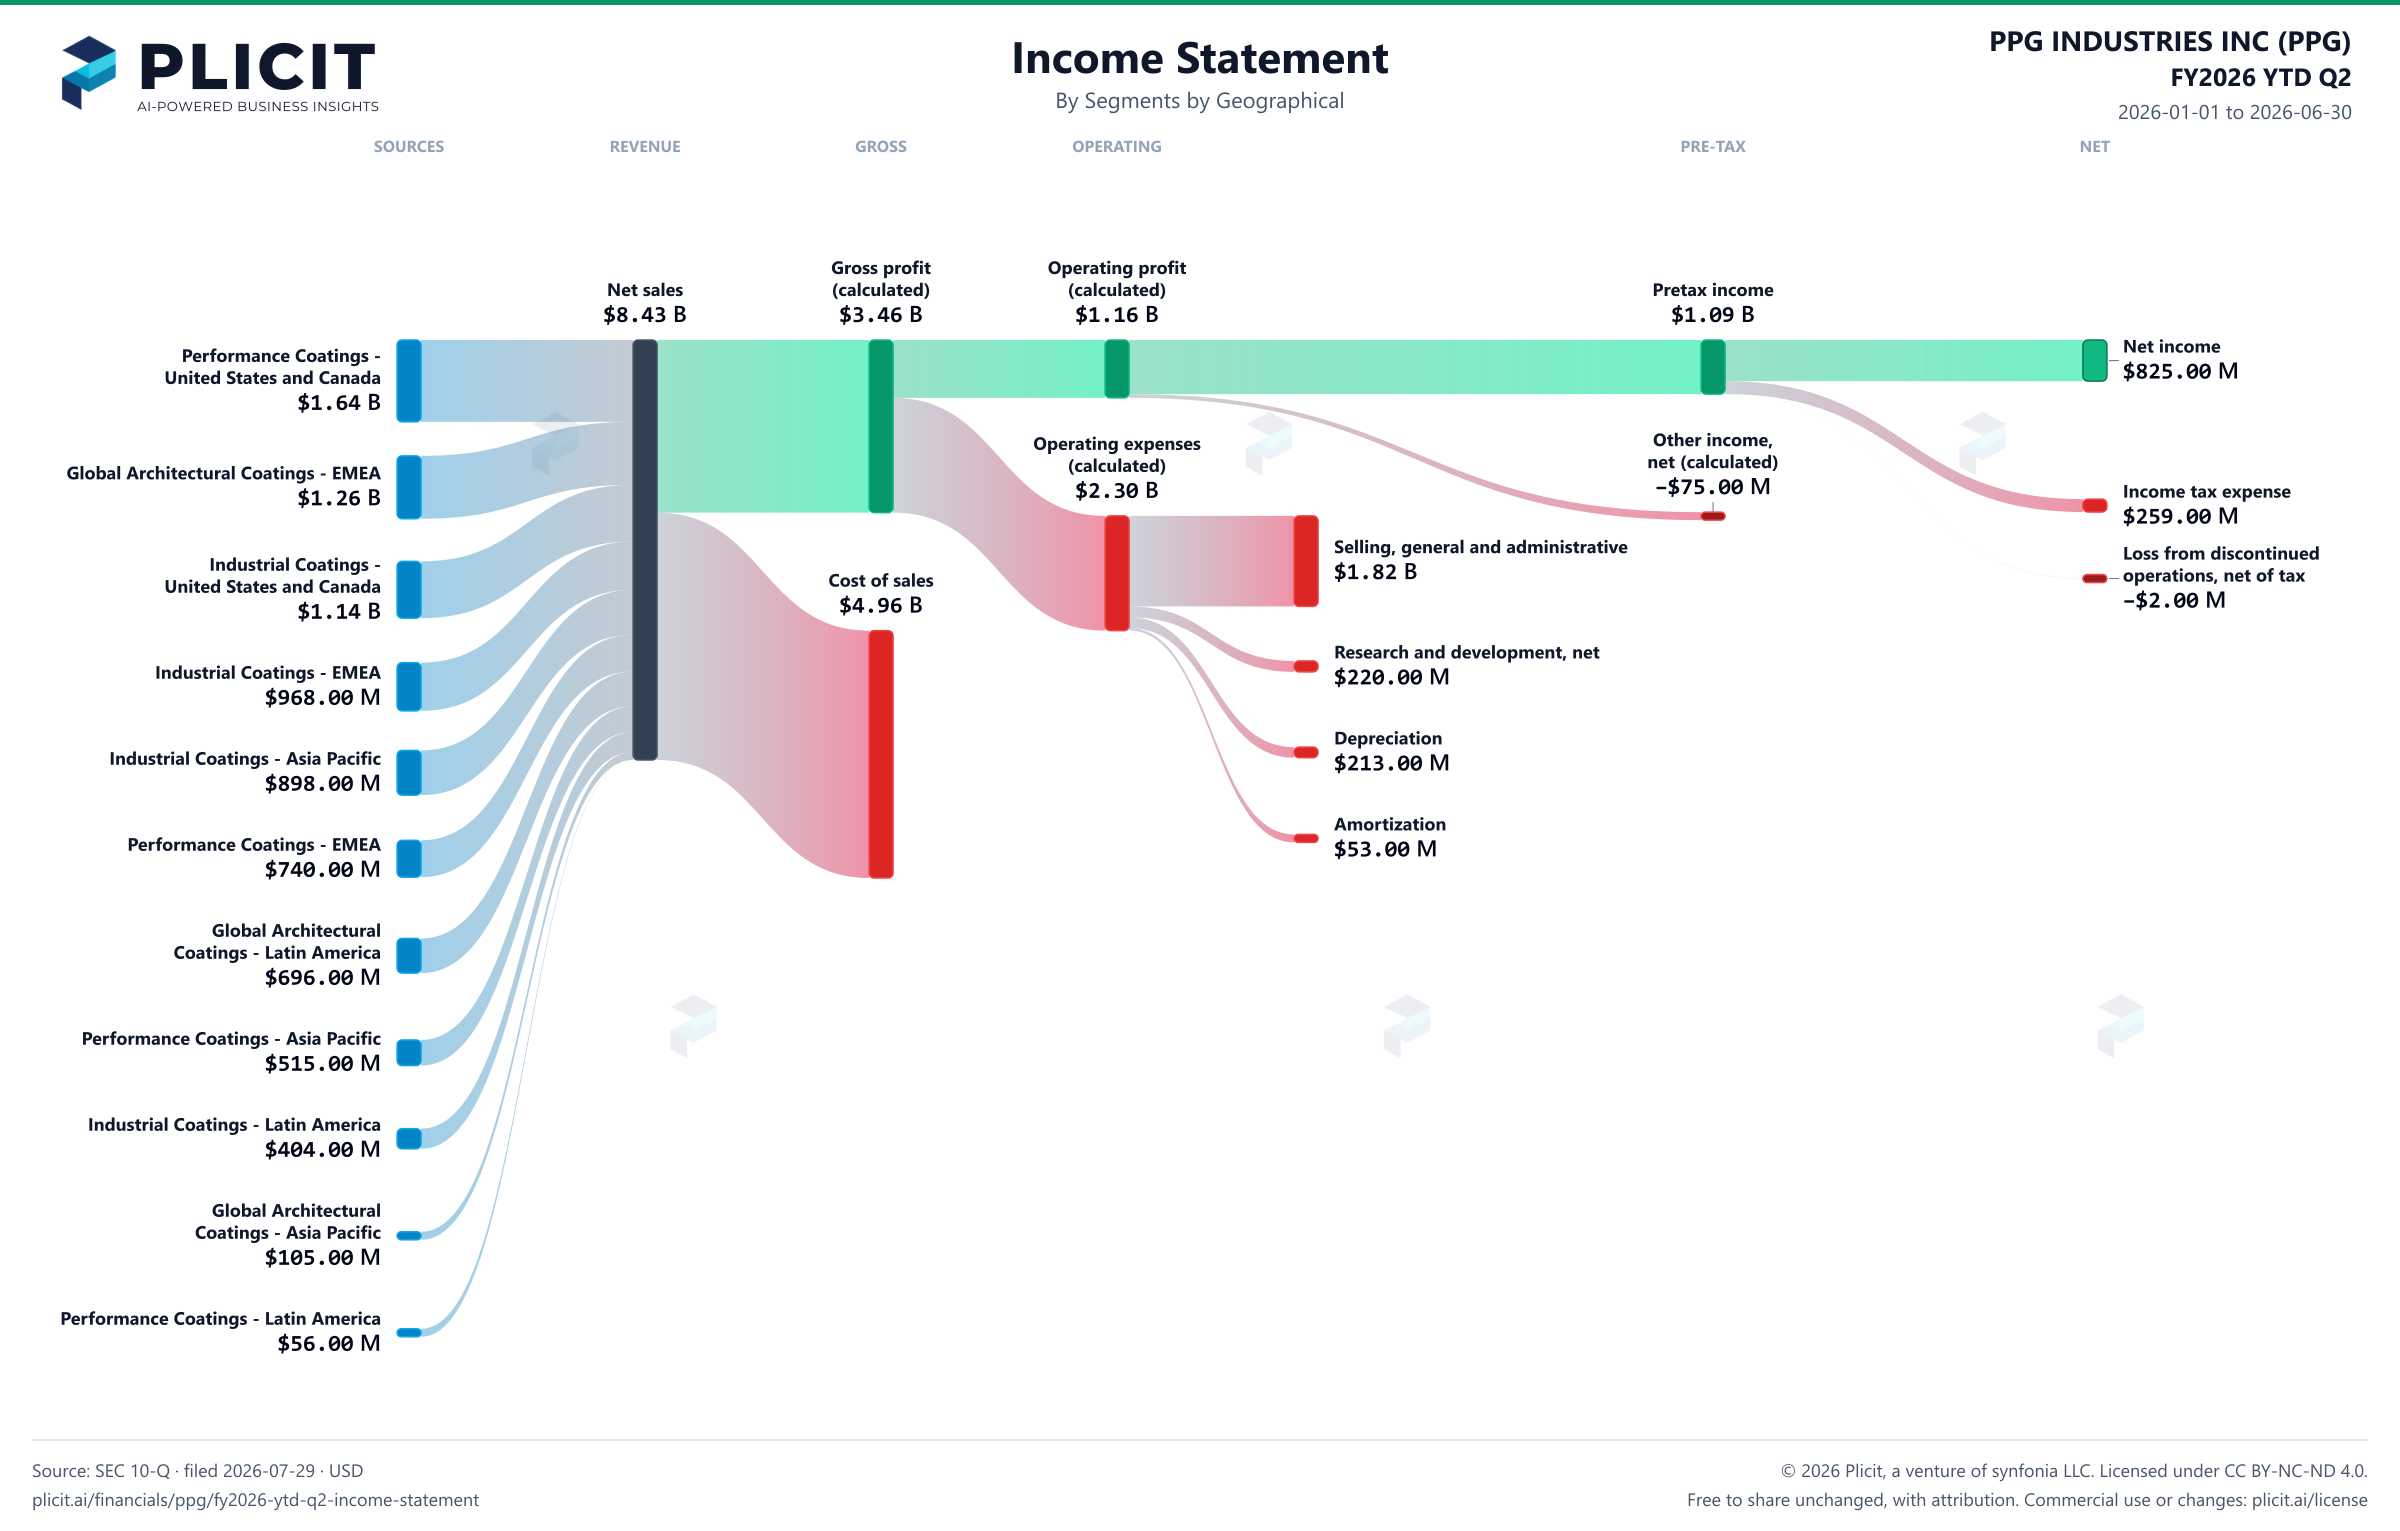
PPG INDUSTRIES INC (PPG) FY2026 YTD Q2 P&L / Income Statement Sankey chart, Segments by Geographical view
Free to share unchanged, with credit to Plicit.ai · CC BY-NC-ND 4.0Download PNG

Gross margin

41.1%

Gross profit / revenue

Operating margin

13.8%

Operating profit / revenue

Cash conversion

71.8%

Operating cash / net income, same period

Newsletter

Get the teardowns by email

Subscribe if you want the public-company teardowns in your inbox when they're released.

Product waitlist

Health Check and Teardown for your own company

A health check uncovers insights of your private books, not a public ticker. Join this list to get notified as soon as we go-live!