
Royalty Pharma plc (RPRX) FY2026 YTD Q2 P&L / Income Statement

Revenue by Product and Service

2026-01-01 to 2026-06-30

Swipe to see the full flow
Royalty Pharma plc (RPRX) FY2026 YTD Q2 P&L / Income StatementIncome statement for 2026-01-01 through 2026-06-30. View: Product and service. Revenue uses this breakdown; costs and expenses retain the consolidated categories.SOURCESREVENUEOPERATINGPRE-TAXNETIncome from financial royalty assetsOther royalty income and revenuesTotal income and other revenuesOperating incomeTotal operating expense, netGeneral and administrative expenses (includes $107,356 and $91,044 of share-based compensation expense for the three months ended June 30, 2026 and 2025, respectively, and $229,648 and $91,747 for the six months ended June 30, 2026 and 2025, respectively; see Note 4)Research and development funding expenseProvision for changes in expected cash flows from financial royalty assetsFinancial royalty asset impairmentProvision for credit losses on unfunded commitmentsConsolidated net income before taxTotal other expense, netConsolidated net incomeTotal income and other revenuesTotal income andother revenues$1.30 BConsolidated net income before taxConsolidated netincome before tax$549.74 MOperating incomeOperating income$696.16 MConsolidated net incomeConsolidatednet income$549.74 MIncome from financial royalty assetsIncome from financial royalty assets$1.23 BTotal operating expense, netTotal operatingexpense, net$608.56 MIncome tax expenseIncome tax expense$0.00Total other expense, netTotal otherexpense, net−$146.42 MGeneral and administrative expenses (includes $107,356 and $91,044 of share-based compensation expense for the three months ended June 30, 2026 and 2025, respectively, and $229,648 and $91,747 for the six months ended June 30, 2026 and 2025, respectively; see Note 4)General andadministrative expenses$321.38 MOther royalty income and revenuesOther royalty income and revenues$71.70 MResearch and development funding expenseResearch and developmentfunding expense$137.64 MProvision for changes in expected cash flows from financial royalty assetsProvision for changes inexpected cash flows fromfinancial royalty assets$70.73 MFinancial royalty asset impairmentFinancial royalty asset impairment$69.44 MProvision for credit losses on unfunded commitmentsProvision for credit losseson unfunded commitments$9.37 M
Chart details

Royalty Pharma plc (RPRX) FY2026 YTD Q2 P&L / Income Statement

Income statement for 2026-01-01 through 2026-06-30. View: Product and service. Revenue uses this breakdown; costs and expenses retain the consolidated categories.

Total income and other revenues
1,304,717,000 US dollars
Total operating expense, net
608,561,000 US dollars
Operating income
696,156,000 US dollars
Total other expense, net
negative 146,415,000 US dollars
Consolidated net income before tax
549,741,000 US dollars
Income tax expense
0 US dollars
Consolidated net income
549,741,000 US dollars
Income from financial royalty assets
1,233,019,000 US dollars
Other royalty income and revenues
71,698,000 US dollars
Provision for changes in expected cash flows from financial royalty assets
70,732,000 US dollars
Provision for credit losses on unfunded commitments
9,368,000 US dollars
Research and development funding expense
137,641,000 US dollars
General and administrative expenses (includes $107,356 and $91,044 of share-based compensation expense for the three months ended June 30, 2026 and 2025, respectively, and $229,648 and $91,747 for the six months ended June 30, 2026 and 2025, respectively; see Note 4)
321,377,000 US dollars
Financial royalty asset impairment
69,443,000 US dollars

Chart connections

  • Revenue minus operating expenses equals operating income.
  • Operating income plus other income or expense equals income before tax. Income before tax less income tax expense or benefit equals net income.
  • Of which attributable to Royalty Pharma plc: $312.57 M; to noncontrolling interests: $237.17 M.
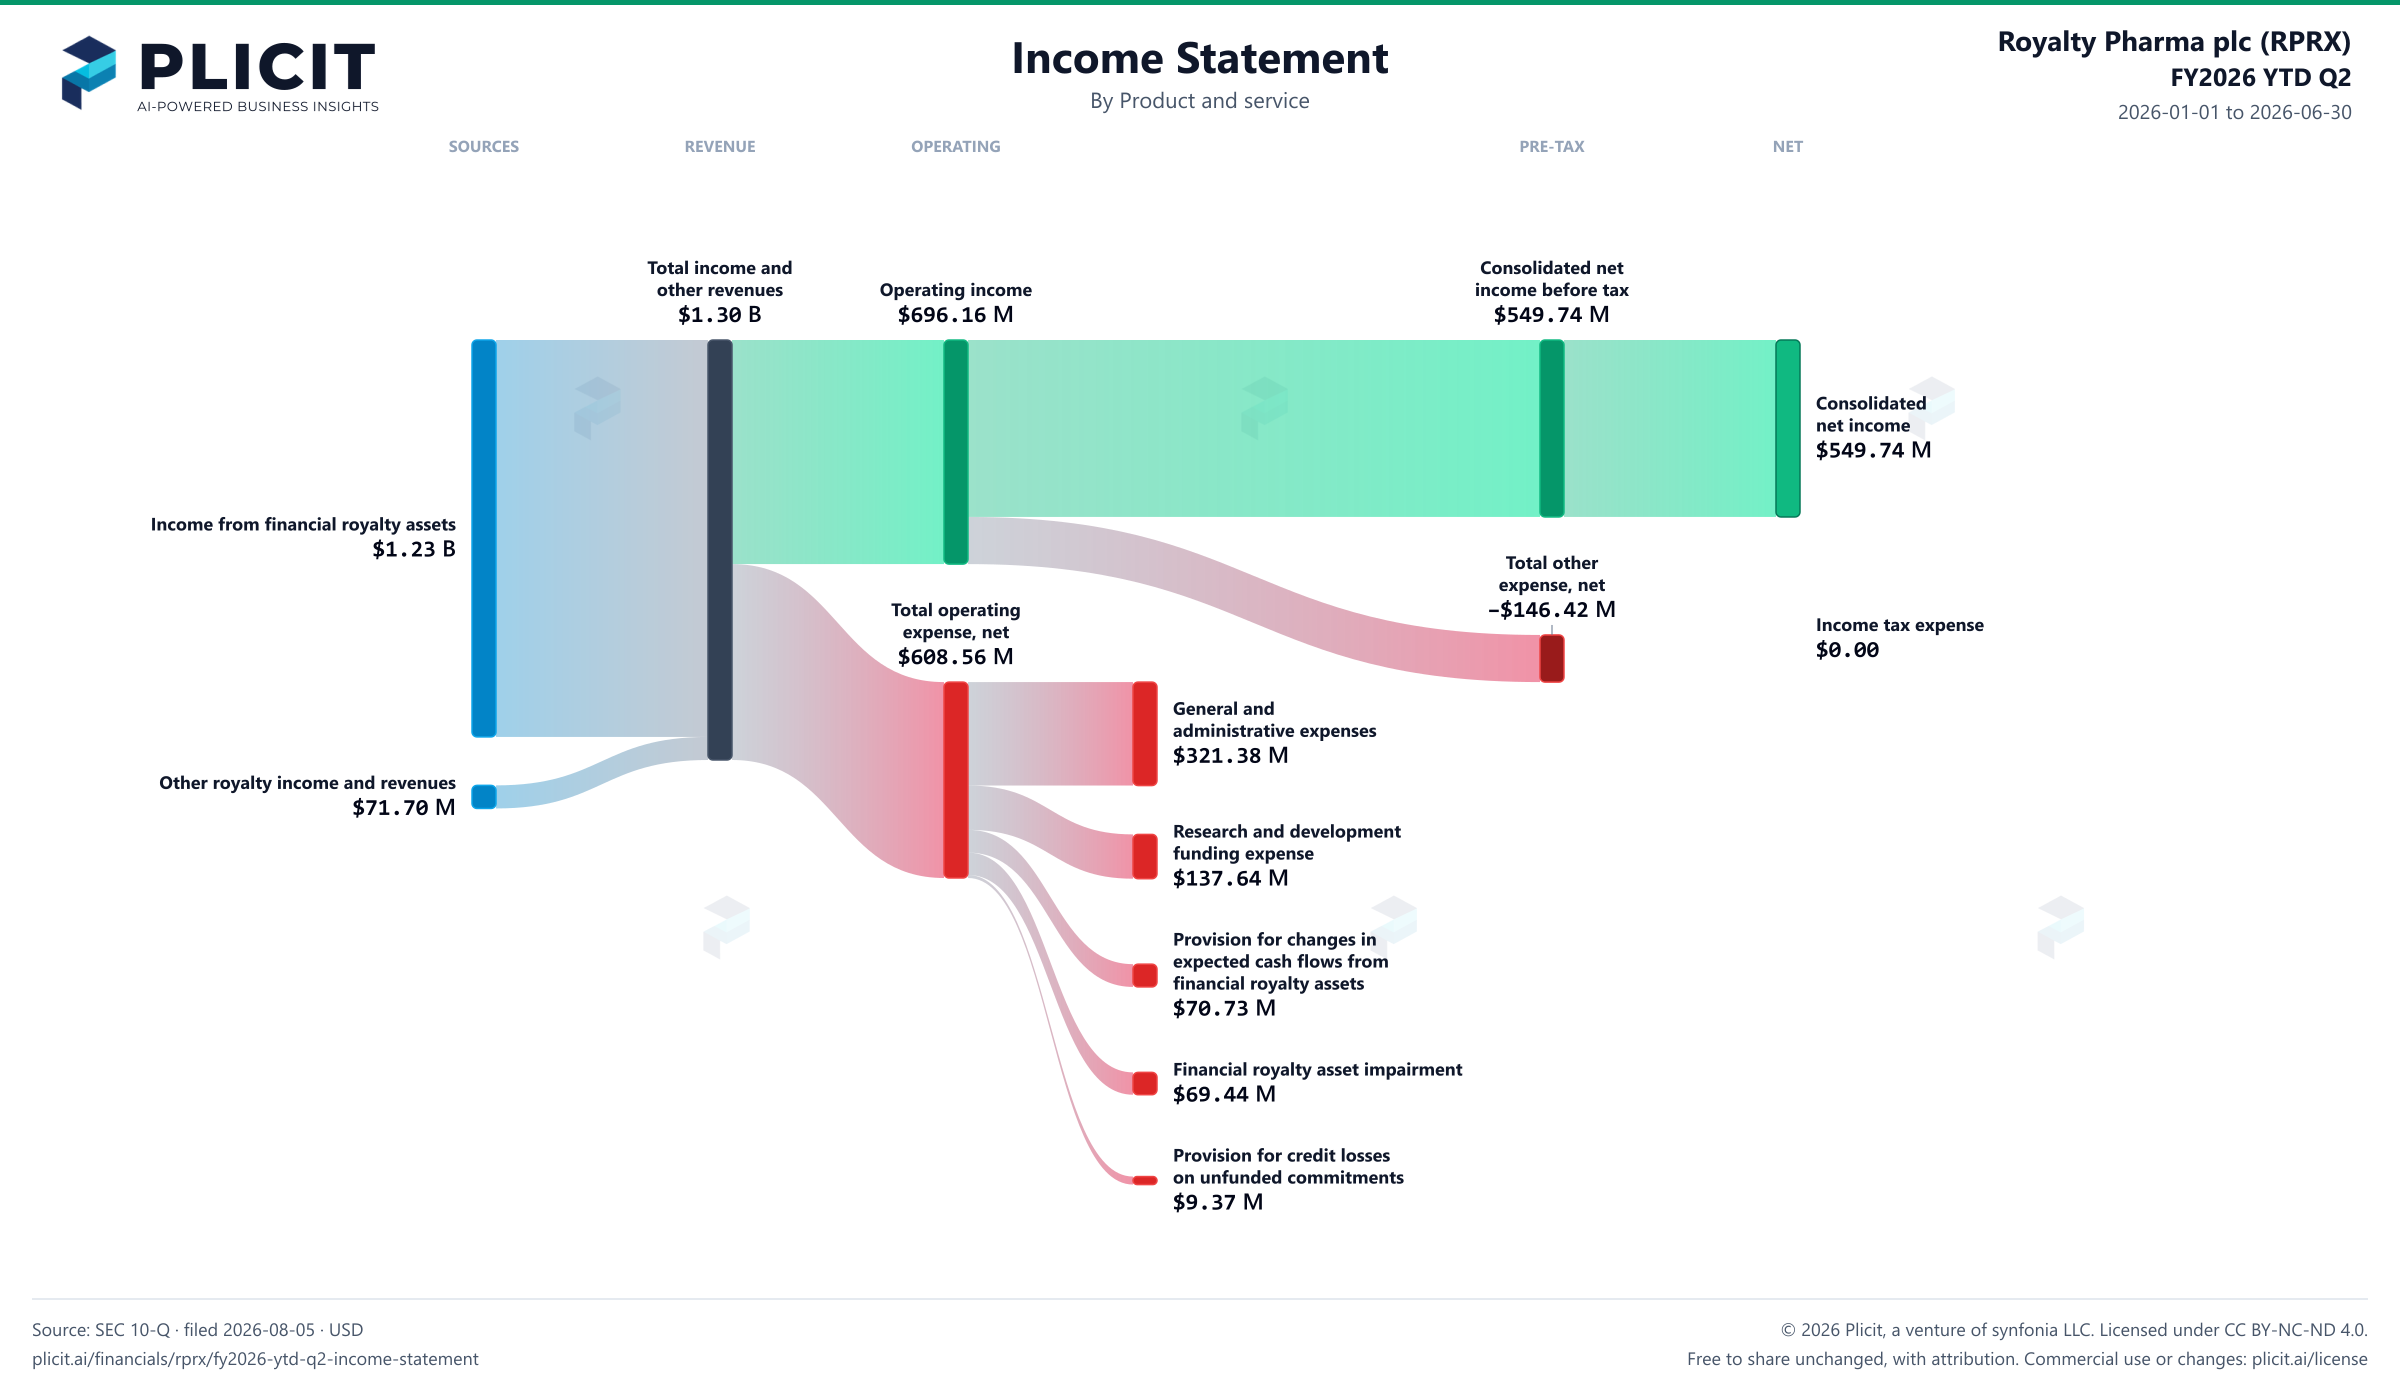
Royalty Pharma plc (RPRX) FY2026 YTD Q2 P&L / Income Statement Sankey chart
Free to share unchanged, with credit to Plicit.ai · CC BY-NC-ND 4.0Download PNG

Operating margin

53.4%

Operating profit / revenue

Cash conversion

263.2%

Operating cash / net income, same period

Newsletter

Get the teardowns by email

Subscribe if you want the public-company teardowns in your inbox when they're released.

Product waitlist

Health Check and Teardown for your own company

A health check uncovers insights of your private books, not a public ticker. Join this list to get notified as soon as we go-live!