
STEPAN COMPANY (SCL) FY2026 YTD Q2 P&L / Income Statement

Revenue by Business Segment by Geography

2026-01-01 to 2026-06-30

Swipe to see the full flow
STEPAN COMPANY (SCL) FY2026 YTD Q2 P&L / Income StatementIncome statement for 2026-01-01 through 2026-06-30. View: Segments by Geographical. Revenue uses this breakdown; costs and expenses retain the consolidated categories.SOURCESREVENUEGROSSOPERATINGPRE-TAXNETSurfactants - North AmericaSurfactants - Latin AmericaSurfactants - EuropePolymers - North AmericaPolymers - EuropeSpecialty Products - North AmericaPolymers - AsiaSurfactants - AsiaSpecialty Products - EuropePolymers - Latin AmericaSpecialty Products - Latin AmericaNet SalesGross ProfitCost of SalesOperating Income (Loss)Operating costs, including other operating expenses (calculated)Business restructuring (Note 16)AdministrativeResearch, development and technical servicesSellingDeferred compensation expenseIncome (Loss) Before Provision for Income TaxesNonoperating Income (Expense)Net Income (Loss)Provision for Income TaxesIncome (Loss) Before Provision for Income TaxesIncome (Loss)Before Provisionfor Income Taxes−$21.94 MOperating Income (Loss)OperatingIncome (Loss)−$12.41 MNet SalesNet Sales$1.29 BGross ProfitGross Profit$164.83 MNet Income (Loss)Net Income (Loss)−$18.50 MOperating costs, including other operating expenses (calculated)Operating costs(calculated)$177.25 MSurfactants - North AmericaSurfactants - North America$532.81 MProvision for Income TaxesProvision forIncome Taxes−$3.45 MCost of SalesCost of Sales$1.12 BBusiness restructuring (Note 16)Business restructuring (Note 16)$70.55 MAdministrativeAdministrative$45.52 MSurfactants - Latin AmericaSurfactants - Latin America$220.12 MResearch, development and technical servicesResearch, developmentand technical services$32.19 MSurfactants - EuropeSurfactants - Europe$176.13 MNonoperating Income (Expense)NonoperatingIncome (Expense)−$9.53 MSellingSelling$27.03 MPolymers - North AmericaPolymers - North America$171.05 MDeferred compensation expenseDeferred compensation expense$1.96 MPolymers - EuropePolymers - Europe$114.84 MSpecialty Products - North AmericaSpecialty Products - North America$37.91 MPolymers - AsiaPolymers - Asia$21.87 MSurfactants - AsiaSurfactants - Asia$8.54 MSpecialty Products - EuropeSpecialty Products - Europe$4.96 MPolymers - Latin AmericaPolymers - Latin America$275.00 KSpecialty Products - Latin AmericaSpecialty Products - Latin America$122.00 K
Chart details

STEPAN COMPANY (SCL) FY2026 YTD Q2 P&L / Income Statement

Income statement for 2026-01-01 through 2026-06-30. View: Segments by Geographical. Revenue uses this breakdown; costs and expenses retain the consolidated categories.

Net Sales
1,288,618,000 US dollars
Cost of Sales
1,123,785,000 US dollars
Gross Profit
164,833,000 US dollars
Operating costs, including other operating expenses (calculated)
177,245,000 US dollars
Operating Income (Loss)
negative 12,412,000 US dollars
Nonoperating Income (Expense)
negative 9,528,000 US dollars
Income (Loss) Before Provision for Income Taxes
negative 21,940,000 US dollars
Provision for Income Taxes
negative 3,445,000 US dollars
Net Income (Loss)
negative 18,495,000 US dollars
Polymers - Asia
21,873,000 US dollars
Polymers - Europe
114,841,000 US dollars
Polymers - Latin America
275,000 US dollars
Polymers - North America
171,047,000 US dollars
Specialty Products - Europe
4,961,000 US dollars
Specialty Products - Latin America
122,000 US dollars
Specialty Products - North America
37,910,000 US dollars
Surfactants - Asia
8,535,000 US dollars
Surfactants - Europe
176,126,000 US dollars
Surfactants - Latin America
220,118,000 US dollars
Surfactants - North America
532,810,000 US dollars
Selling
27,032,000 US dollars
Administrative
45,516,000 US dollars
Research, development and technical services
32,188,000 US dollars
Deferred compensation expense
1,964,000 US dollars
Business restructuring (Note 16)
70,545,000 US dollars

Chart connections

  • Revenue less cost of revenue equals gross profit; gross profit less operating expenses equals operating income.
  • Operating income plus other income or expense equals income before tax. Income before tax less income tax expense or benefit equals net income.
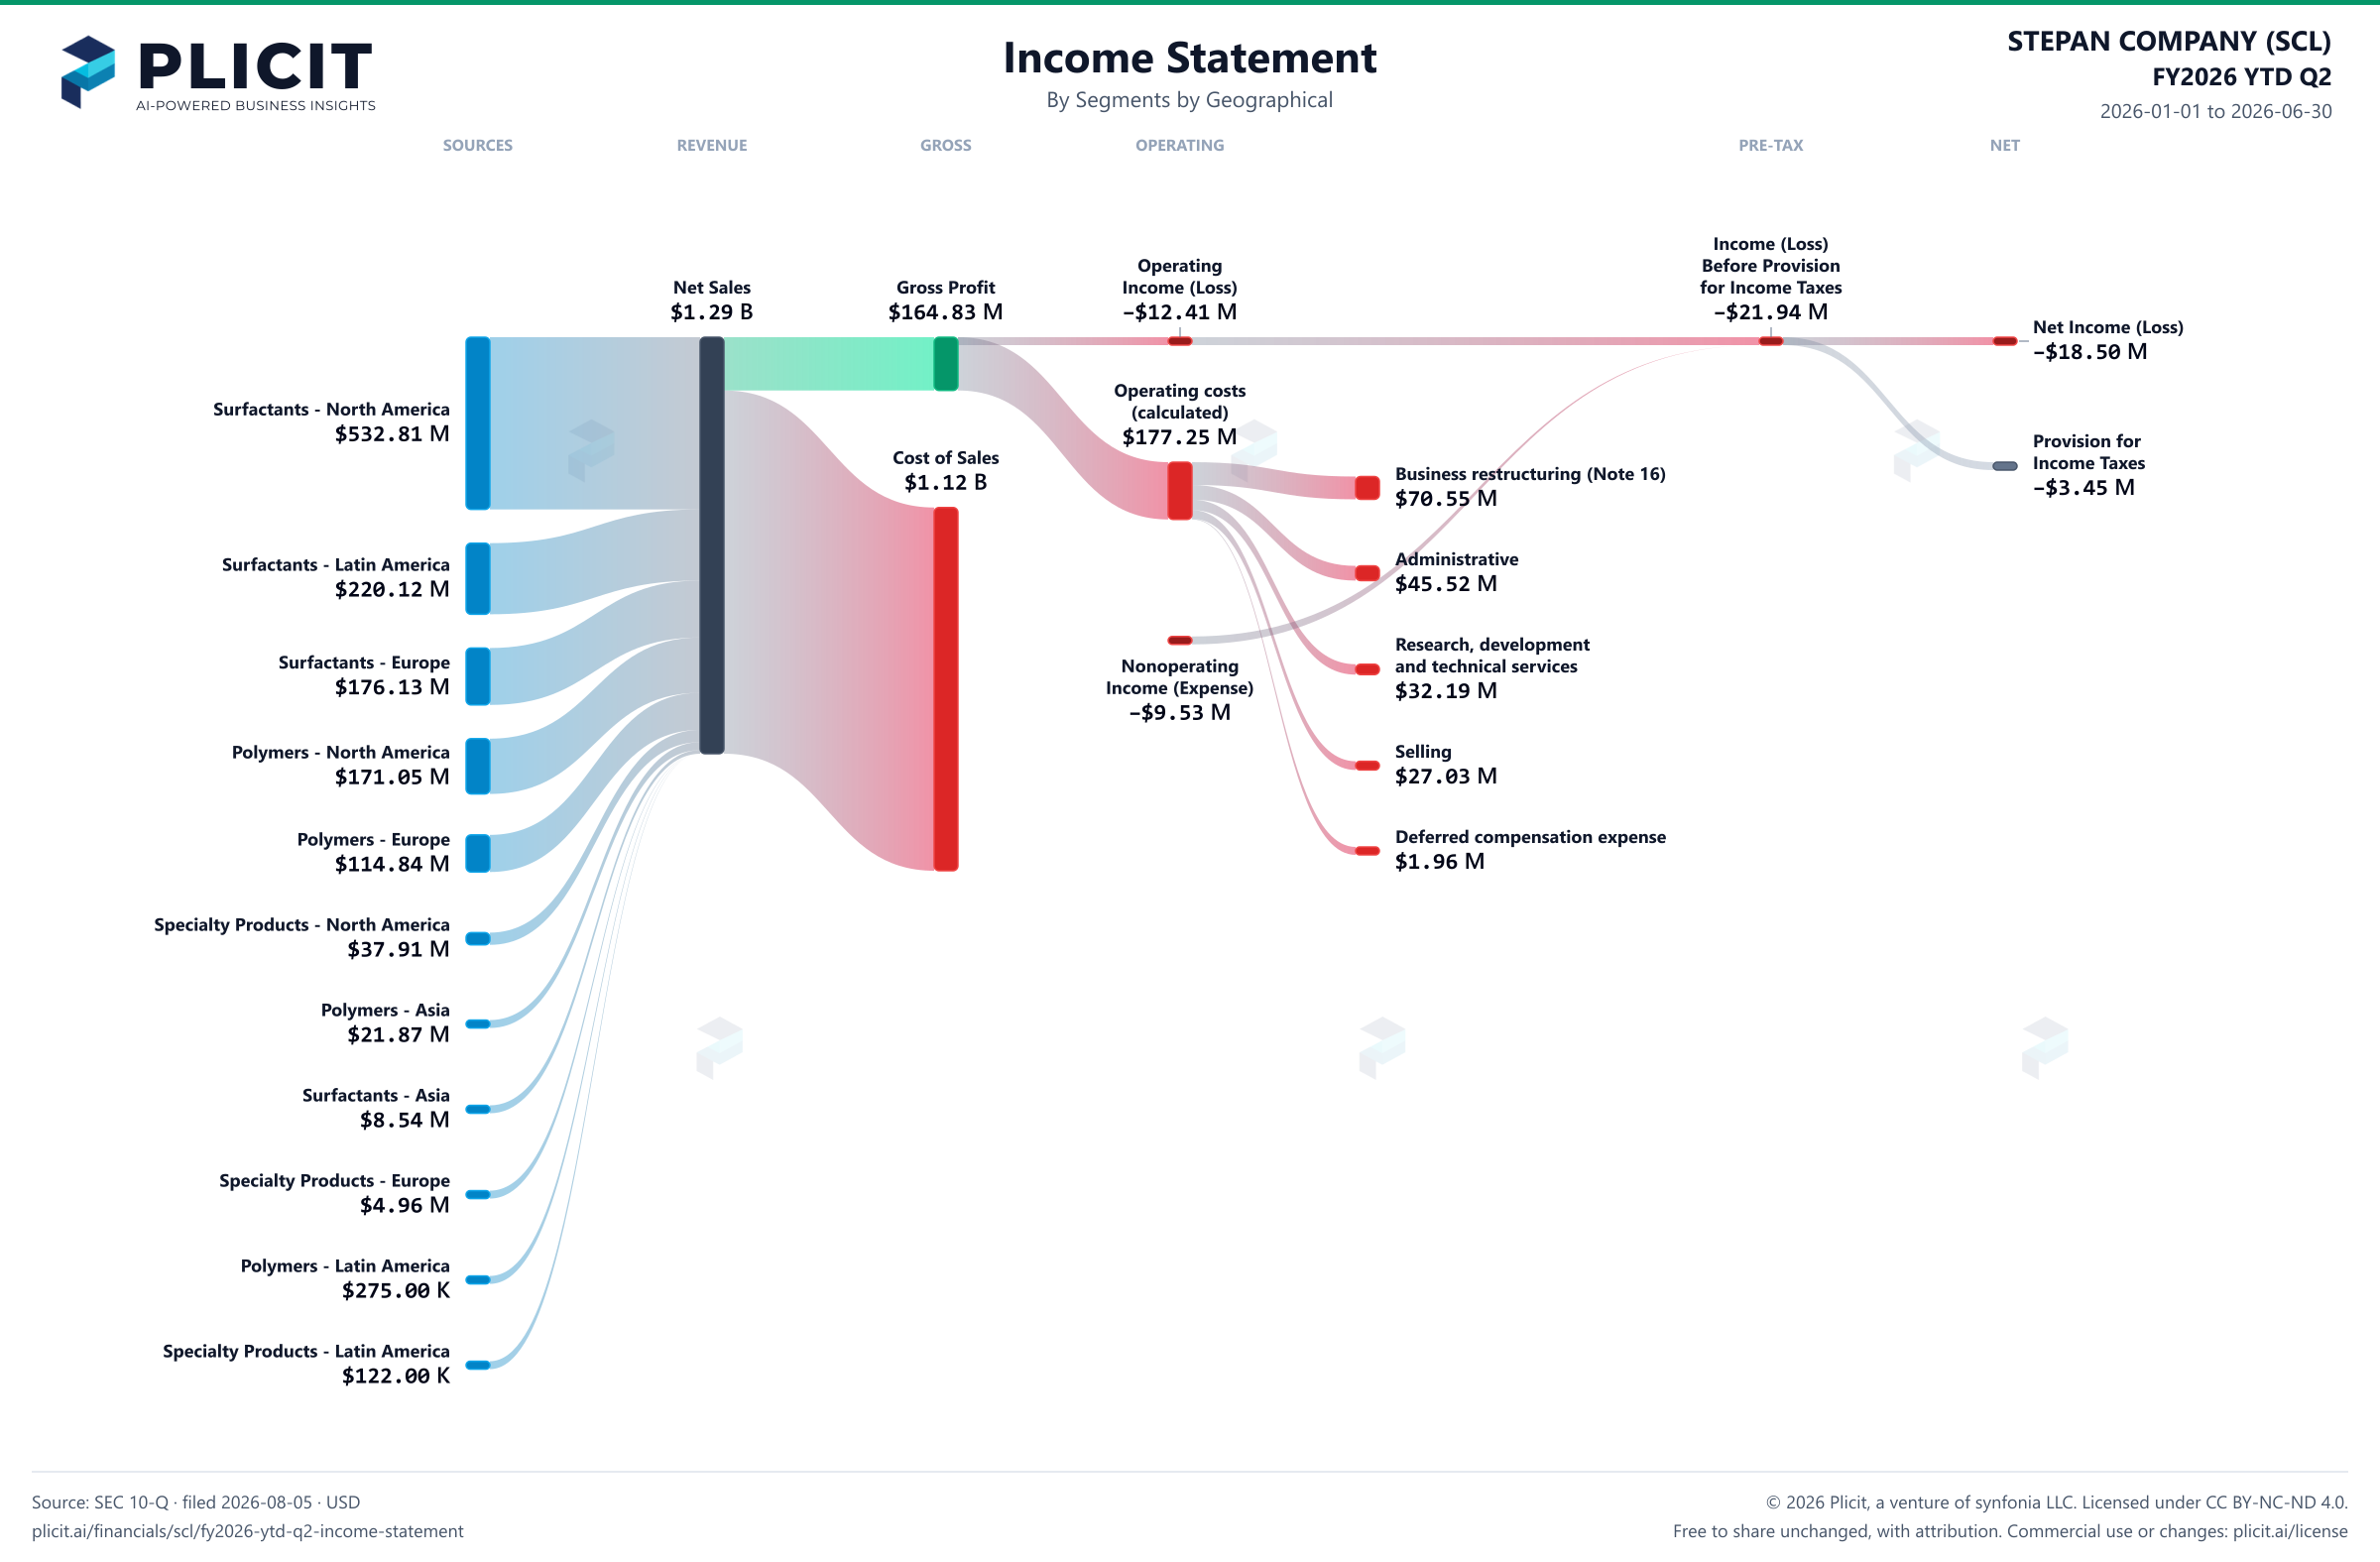
STEPAN COMPANY (SCL) FY2026 YTD Q2 P&L / Income Statement Sankey chart, Segments by Geographical view
Free to share unchanged, with credit to Plicit.ai · CC BY-NC-ND 4.0Download PNG

Gross margin

12.8%

Gross profit / revenue

Operating margin

−1.0%

Operating profit / revenue

Newsletter

Get the teardowns by email

Subscribe if you want the public-company teardowns in your inbox when they're released.

Product waitlist

Health Check and Teardown for your own company

A health check uncovers insights of your private books, not a public ticker. Join this list to get notified as soon as we go-live!