
SPHERE ENTERTAINMENT CO. (SPHR) FY2026 YTD Q2 P&L / Income Statement

Revenue by Product and Service

2026-01-01 to 2026-06-30

Swipe to see the full flow
SPHERE ENTERTAINMENT CO. (SPHR) FY2026 YTD Q2 P&L / Income StatementIncome statement for 2026-01-01 through 2026-06-30. View: Product and service. Revenue uses this breakdown; costs and expenses retain the consolidated categories.SOURCESREVENUEGROSSOPERATINGPRE-TAXNETTicketing and venue license fee revenuesMedia networks revenuesFood, beverage, and merchandise revenuesSponsorship, signage, Exosphere advertising, and suite license revenuesRevenues from subleasesOtherRevenuesGross profit (calculated)Cost of revenue (calculated)Direct operating expensesOperating lossOperating costs, including other operating expenses (calculated)Selling, general and administrative expensesDepreciation and amortizationRestructuring chargesImpairments and other losses, net(Loss) income from continuing operations before income taxesOther income (expense), net (calculated)Net (loss) incomeIncome tax benefit (expense)(Loss) income from continuing operations before income taxes(Loss) income fromcontinuing operationsbefore income taxes−$65.63 MGross profit (calculated)Gross profit(calculated)$379.34 MRevenuesRevenues$700.05 MOperating lossOperating loss−$54.06 MNet (loss) incomeNet (loss) income−$33.87 MOperating costs, including other operating expenses (calculated)Operating costs(calculated)$433.40 MTicketing and venue license fee revenuesTicketing and venuelicense fee revenues$348.54 MIncome tax benefit (expense)Income tax benefit(expense)−$31.77 MSelling, general and administrative expensesSelling, general andadministrative expenses$260.91 MCost of revenue (calculated)Cost of revenue(calculated)$320.71 MMedia networks revenuesMedia networks revenues$207.73 MDepreciation and amortizationDepreciation and amortization$168.68 MFood, beverage, and merchandise revenuesFood, beverage, andmerchandise revenues$69.67 MRestructuring chargesRestructuring charges$3.74 MDirect operating expensesDirect operatingexpenses$320.71 MSponsorship, signage, Exosphere advertising, and suite license revenuesSponsorship, signage,Exosphere advertising,and suite license revenues$61.83 MOther income (expense), net (calculated)Other income,net (calculated)−$11.57 MImpairments and other losses, netImpairments and other losses, net$79.00 KRevenues from subleasesRevenues from subleases$875.00 KOtherOther$11.41 M
Chart details

SPHERE ENTERTAINMENT CO. (SPHR) FY2026 YTD Q2 P&L / Income Statement

Income statement for 2026-01-01 through 2026-06-30. View: Product and service. Revenue uses this breakdown; costs and expenses retain the consolidated categories.

Revenues
700,051,000 US dollars
Cost of revenue (calculated)
320,710,000 US dollars
Gross profit (calculated)
379,341,000 US dollars
Operating costs, including other operating expenses (calculated)
433,401,000 US dollars
Operating loss
negative 54,060,000 US dollars
Other income (expense), net (calculated)
negative 11,574,000 US dollars
(Loss) income from continuing operations before income taxes
negative 65,634,000 US dollars
Income tax benefit (expense)
negative 31,767,000 US dollars
Net (loss) income
negative 33,867,000 US dollars
Ticketing and venue license fee revenues
348,538,000 US dollars
Sponsorship, signage, Exosphere advertising, and suite license revenues
61,826,000 US dollars
Food, beverage, and merchandise revenues
69,669,000 US dollars
Media networks revenues
207,733,000 US dollars
Other
11,410,000 US dollars
Revenues from subleases
875,000 US dollars
Direct operating expenses
320,710,000 US dollars
Selling, general and administrative expenses
260,910,000 US dollars
Depreciation and amortization
168,675,000 US dollars
Restructuring charges
3,737,000 US dollars
Impairments and other losses, net
79,000 US dollars

Chart connections

  • Revenue less cost of revenue equals gross profit; gross profit less operating expenses equals operating income.
  • Operating income plus other income or expense equals income before tax. Income before tax less income tax expense or benefit equals net income.
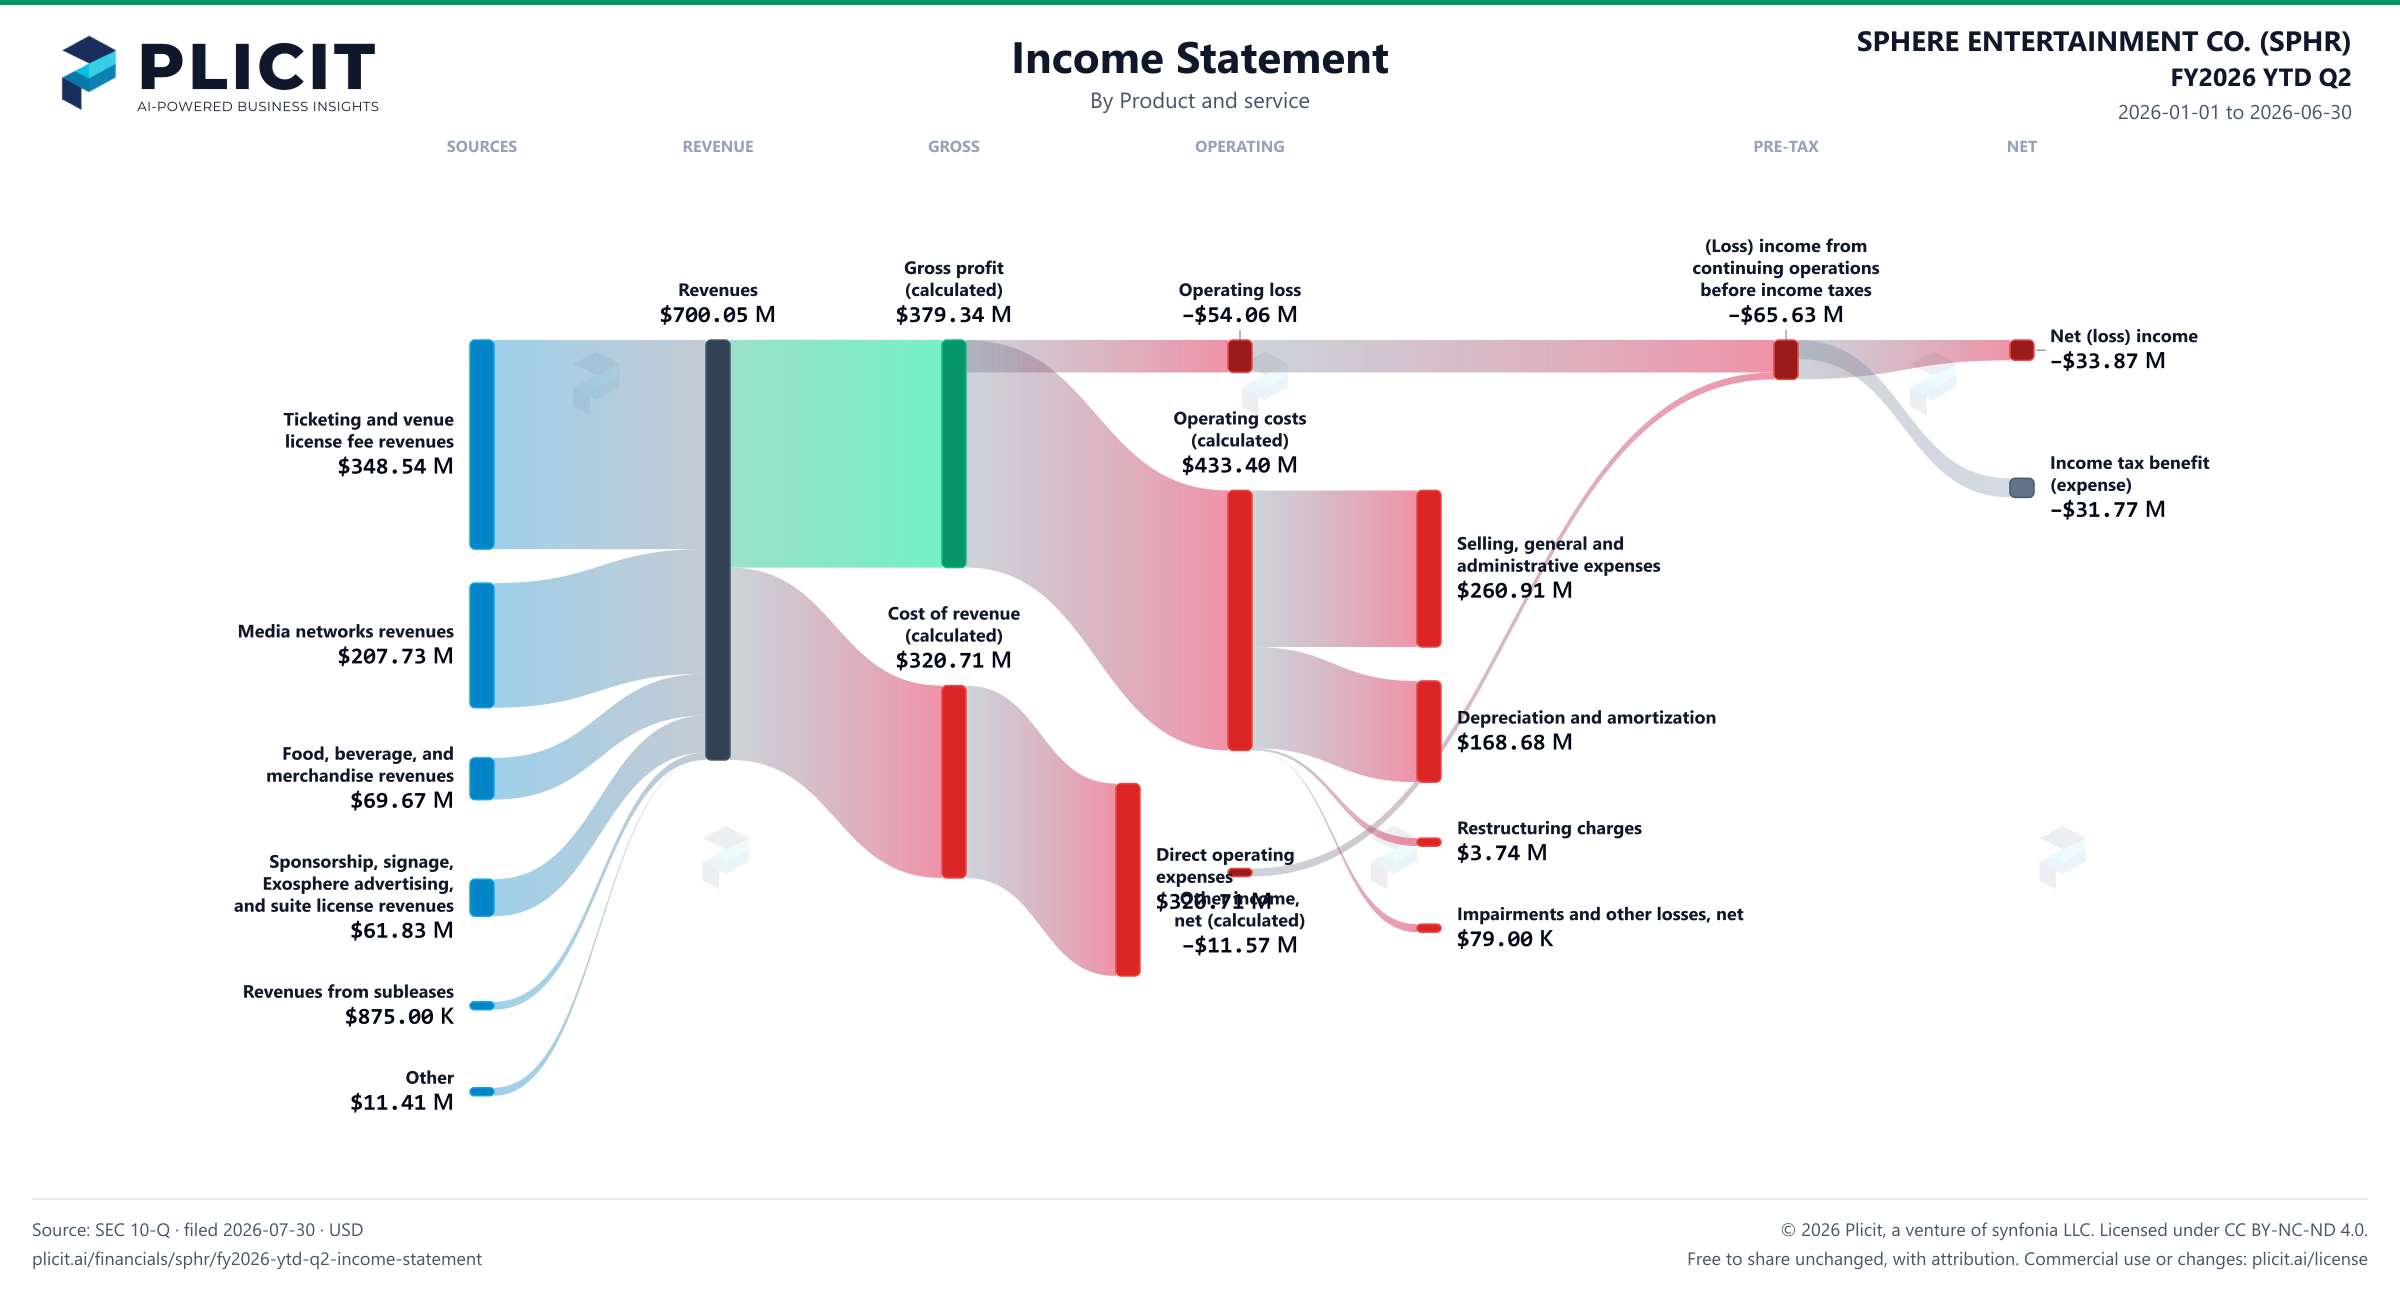
SPHERE ENTERTAINMENT CO. (SPHR) FY2026 YTD Q2 Revenue by Product and Service Sankey chart
Free to share unchanged, with credit to Plicit.ai · CC BY-NC-ND 4.0Download PNG

Gross margin

54.2%

Gross profit / revenue

Operating margin

−7.7%

Operating profit / revenue

Newsletter

Get the teardowns by email

Subscribe if you want the public-company teardowns in your inbox when they're released.

Product waitlist

Health Check and Teardown for your own company

A health check uncovers insights of your private books, not a public ticker. Join this list to get notified as soon as we go-live!