
Strategic Education, Inc. (STRA) FY2026 YTD Q2 P&L / Income Statement

Revenue by Business Segment by Product and Service

2026-01-01 to 2026-06-30

Swipe to see the full flow
Strategic Education, Inc. (STRA) FY2026 YTD Q2 P&L / Income StatementIncome statement for 2026-01-01 through 2026-06-30. View: Segments by Product and Service. Revenue uses this breakdown; costs and expenses retain the consolidated categories.SOURCESREVENUEOPERATINGPRE-TAXNETU.S. Higher Education Segment - Tuition, net of discounts, grants and scholarshipsAustralia/New Zealand Segment - Tuition, net of discounts, grants and scholarshipsEducation Technology Services SegmentU.S. Higher Education Segment - OtherAustralia/New Zealand Segment - OtherRevenuesIncome from operationsTotal costs and expensesInstructional and support costsGeneral and administrationRestructuring costsOther income (expense), net (calculated)Income before income taxesNet incomeProvision for income taxesOther income (expense), net (calculated)Other income,net (calculated)$2.56 MIncome before income taxesPretax income$94.12 MRevenuesRevenues$643.19 MIncome from operationsIncome from operations$91.57 MNet incomeNet income$69.97 MU.S. Higher Education Segment - Tuition, net of discounts, grants and scholarshipsU.S. Higher Education Segment -Tuition, net, grants and scholarships$410.15 MTotal costs and expensesCosts and expenses$551.63 MProvision for income taxesProvision forincome taxes$24.15 MInstructional and support costsInstructional and support costs$332.64 MAustralia/New Zealand Segment - Tuition, net of discounts, grants and scholarshipsAustralia/New Zealand Segment -Tuition, net, grants and scholarships$124.49 MEducation Technology Services SegmentEducation TechnologyServices Segment$83.87 MGeneral and administrationGeneral and administration$214.42 MU.S. Higher Education Segment - OtherU.S. Higher Education Segment - Other$22.96 MRestructuring costsRestructuring costs$4.57 MAustralia/New Zealand Segment - OtherAustralia/New ZealandSegment - Other$1.71 M
Chart details

Strategic Education, Inc. (STRA) FY2026 YTD Q2 P&L / Income Statement

Income statement for 2026-01-01 through 2026-06-30. View: Segments by Product and Service. Revenue uses this breakdown; costs and expenses retain the consolidated categories.

Revenues
643,192,000 US dollars
Total costs and expenses
551,627,000 US dollars
Income from operations
91,565,000 US dollars
Other income (expense), net (calculated)
2,556,000 US dollars
Income before income taxes
94,121,000 US dollars
Provision for income taxes
24,153,000 US dollars
Net income
69,968,000 US dollars
Education Technology Services Segment
83,871,000 US dollars
Australia/New Zealand Segment - Tuition, net of discounts, grants and scholarships
124,491,000 US dollars
Australia/New Zealand Segment - Other
1,713,000 US dollars
U.S. Higher Education Segment - Tuition, net of discounts, grants and scholarships
410,154,000 US dollars
U.S. Higher Education Segment - Other
22,963,000 US dollars
General and administration
214,417,000 US dollars
Restructuring costs
4,567,000 US dollars
Instructional and support costs
332,643,000 US dollars

Chart connections

  • Revenue minus operating expenses equals operating income.
  • Operating income plus other income or expense equals income before tax. Income before tax less income tax expense or benefit equals net income.
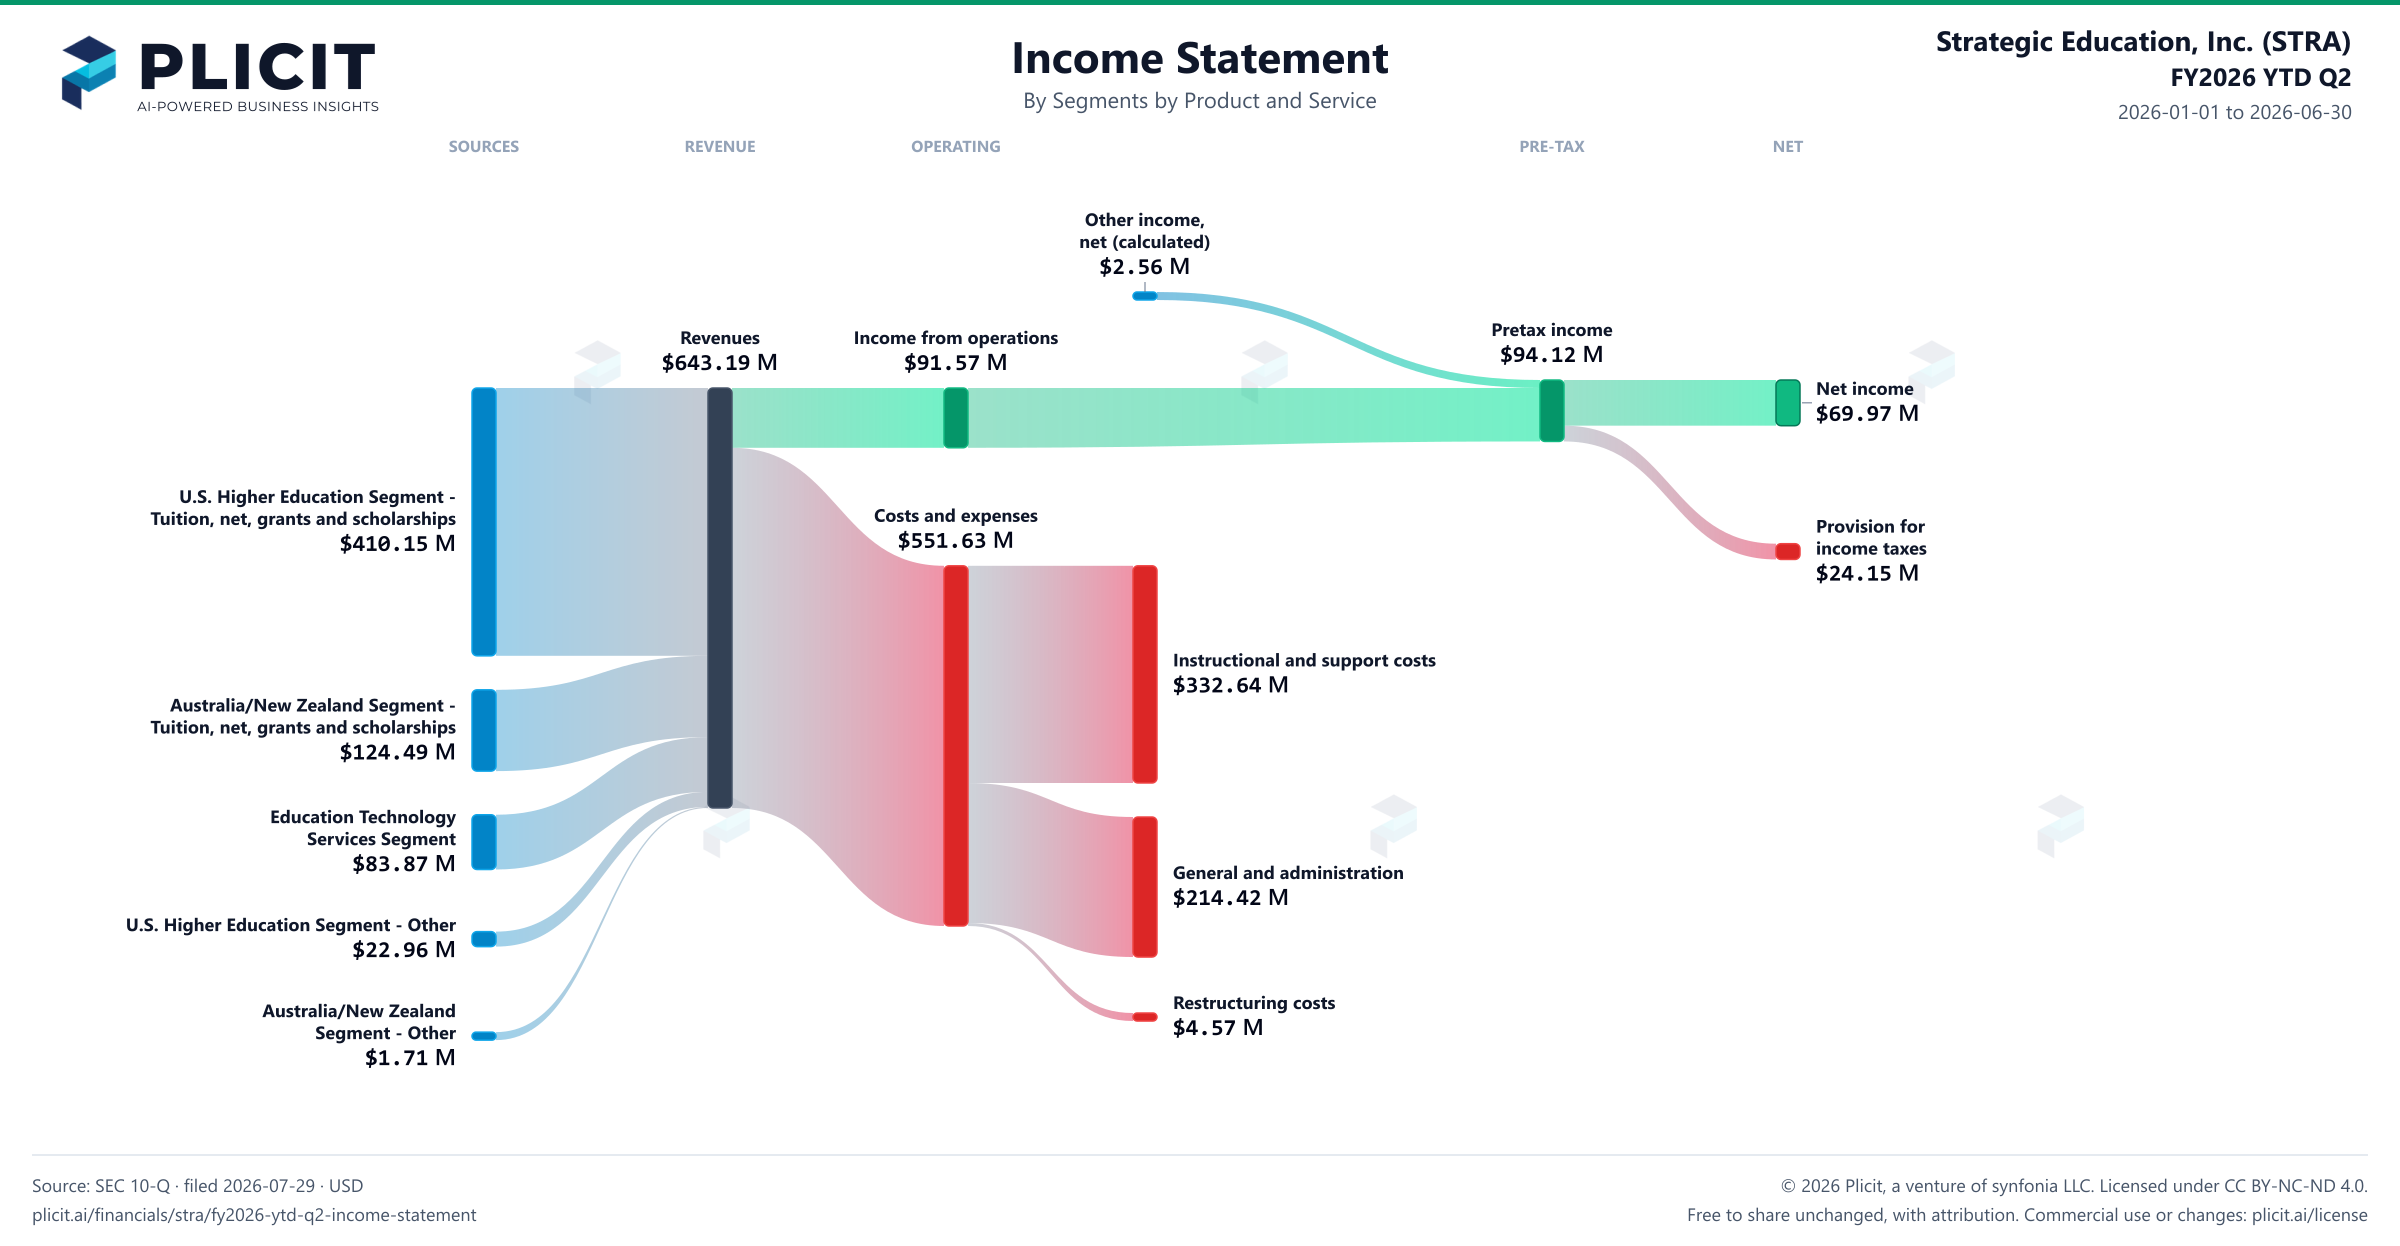
Strategic Education, Inc. (STRA) FY2026 YTD Q2 P&L / Income Statement Sankey chart, Segments by Product and Service view
Free to share unchanged, with credit to Plicit.ai · CC BY-NC-ND 4.0Download PNG

Operating margin

14.2%

Operating profit / revenue

Cash conversion

166.6%

Operating cash / net income, same period

Newsletter

Get the teardowns by email

Subscribe if you want the public-company teardowns in your inbox when they're released.

Product waitlist

Health Check and Teardown for your own company

A health check uncovers insights of your private books, not a public ticker. Join this list to get notified as soon as we go-live!