
STRYKER CORP (SYK) FY2024 YTD Q3 P&L / Income Statement

Revenue by Business Segment by Product and Service

2024-01-01 to 2024-09-30

Swipe to see the full flow
STRYKER CORP (SYK) FY2024 YTD Q3 P&L / Income StatementIncome statement for 2024-01-01 through 2024-09-30. View: Segments by Product and Service. Revenue uses this breakdown; costs and expenses retain the consolidated categories.SOURCESREVENUEGROSSOPERATINGPRE-TAXNETMedSurg and Neurotechnology - MedicalOrthopaedics and Spine - Trauma and ExtremitiesMedSurg and Neurotechnology - EndoscopyMedSurg and Neurotechnology - InstrumentsOrthopaedics and Spine - KneesOrthopaedics and Spine - HipsMedSurg and Neurotechnology - Neuro CranialMedSurg and Neurotechnology - NeurovascularOrthopaedics and Spine - SpineOrthopaedics and Spine - OtherNet salesGross profitCost of salesOperating incomeTotal operating expensesSelling, general and administrative expensesResearch, development and engineering expensesAmortization of intangible assetsEarnings before income taxesOther income (expense), netNet earningsIncome taxesEarnings before income taxesEarnings beforeincome taxes$2.96 BNet salesNet sales$16.16 BGross profitGross profit$10.27 BOperating incomeOperating income$3.11 BMedSurg and Neurotechnology - MedicalMedSurg andNeurotechnology - Medical$2.71 BNet earningsNet earnings$2.45 BOrthopaedics and Spine - Trauma and ExtremitiesOrthopaedics and Spine- Trauma and Extremities$2.51 BTotal operating expensesTotal operatingexpenses$7.16 BIncome taxesIncome taxes$517.00 MOther income (expense), netOther income(expense), net−$144.00 MMedSurg and Neurotechnology - EndoscopyMedSurg andNeurotechnology - Endoscopy$2.38 BSelling, general and administrative expensesSelling, general andadministrative expenses$5.58 BCost of salesCost of sales$5.89 BMedSurg and Neurotechnology - InstrumentsMedSurg and Neurotechnology- Instruments$2.04 BResearch, development and engineering expensesResearch, developmentand engineering expenses$1.11 BOrthopaedics and Spine - KneesOrthopaedics and Spine - Knees$1.76 BAmortization of intangible assetsAmortization of intangible assets$467.00 MOrthopaedics and Spine - HipsOrthopaedics and Spine - Hips$1.24 BMedSurg and Neurotechnology - Neuro CranialMedSurg and Neurotechnology- Neuro Cranial$1.24 BMedSurg and Neurotechnology - NeurovascularMedSurg and Neurotechnology- Neurovascular$966.00 MOrthopaedics and Spine - SpineOrthopaedics and Spine - Spine$911.00 MOrthopaedics and Spine - OtherOrthopaedics and Spine - Other$396.00 M
Chart details

STRYKER CORP (SYK) FY2024 YTD Q3 P&L / Income Statement

Income statement for 2024-01-01 through 2024-09-30. View: Segments by Product and Service. Revenue uses this breakdown; costs and expenses retain the consolidated categories.

Net sales
16,159,000,000 US dollars
Cost of sales
5,893,000,000 US dollars
Gross profit
10,266,000,000 US dollars
Total operating expenses
7,158,000,000 US dollars
Operating income
3,108,000,000 US dollars
Other income (expense), net
negative 144,000,000 US dollars
Earnings before income taxes
2,964,000,000 US dollars
Income taxes
517,000,000 US dollars
Net earnings
2,447,000,000 US dollars
MedSurg and Neurotechnology - Endoscopy
2,383,000,000 US dollars
MedSurg and Neurotechnology - Instruments
2,044,000,000 US dollars
MedSurg and Neurotechnology - Medical
2,710,000,000 US dollars
MedSurg and Neurotechnology - Neuro Cranial
1,237,000,000 US dollars
MedSurg and Neurotechnology - Neurovascular
966,000,000 US dollars
Orthopaedics and Spine - Hips
1,241,000,000 US dollars
Orthopaedics and Spine - Knees
1,760,000,000 US dollars
Orthopaedics and Spine - Other
396,000,000 US dollars
Orthopaedics and Spine - Spine
911,000,000 US dollars
Orthopaedics and Spine - Trauma and Extremities
2,511,000,000 US dollars
Research, development and engineering expenses
1,108,000,000 US dollars
Selling, general and administrative expenses
5,583,000,000 US dollars
Amortization of intangible assets
467,000,000 US dollars

Chart connections

  • Revenue less cost of revenue equals gross profit; gross profit less operating expenses equals operating income.
  • Operating income plus other income or expense equals income before tax. Income before tax less income tax expense or benefit equals net income.
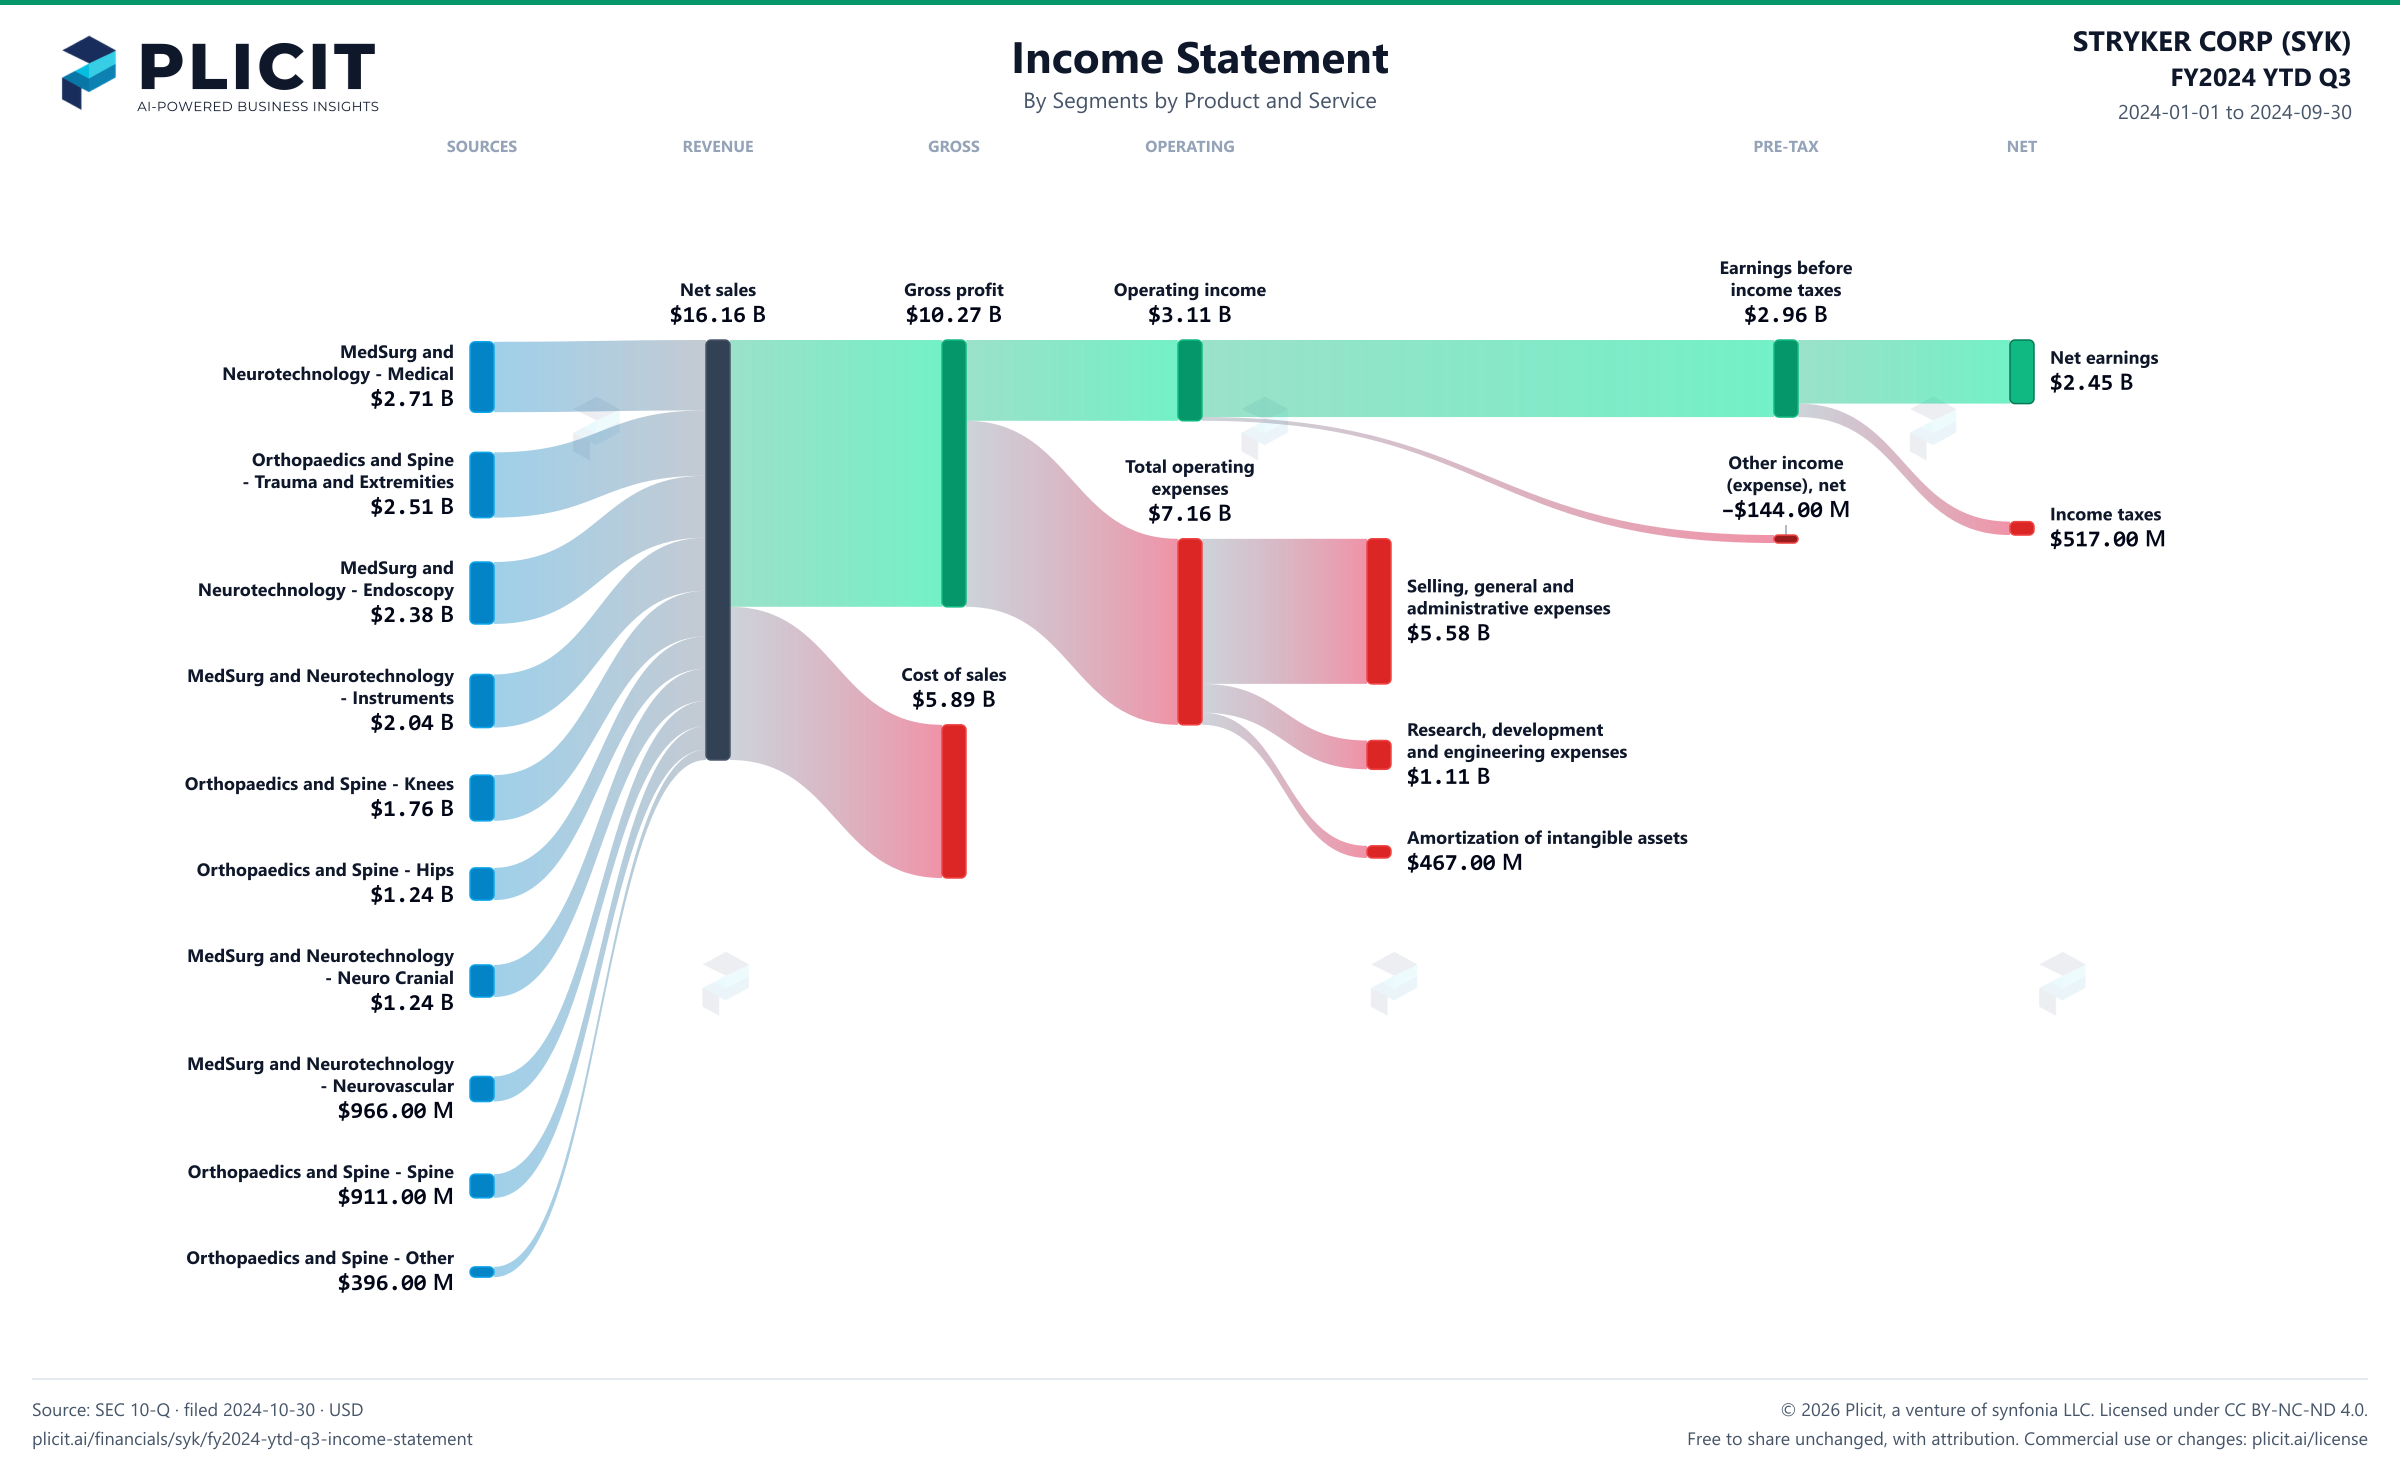
STRYKER CORP (SYK) FY2024 YTD Q3 P&L / Income Statement Sankey chart, Segments by Product and Service view
Free to share unchanged, with credit to Plicit.ai · CC BY-NC-ND 4.0Download PNG

Gross margin

63.5%

Gross profit / revenue

Operating margin

19.2%

Operating profit / revenue

Cash conversion

94.4%

Operating cash / net income, same period

Newsletter

Get the teardowns by email

Subscribe if you want the public-company teardowns in your inbox when they're released.

Product waitlist

Health Check and Teardown for your own company

A health check uncovers insights of your private books, not a public ticker. Join this list to get notified as soon as we go-live!