
Sysco Corporation (SYY) FY2025 YTD Q3 P&L / Income Statement

Revenue by Business Segment by Product and Service

2024-06-30 to 2025-03-29

Swipe to see the full flow
Sysco Corporation (SYY) FY2025 YTD Q3 P&L / Income StatementIncome statement for 2024-06-30 through 2025-03-29. View: Segments by Product and Service. Revenue uses this breakdown; costs and expenses retain the consolidated categories.SOURCESREVENUEGROSSOPERATINGPRE-TAXNETUS Foodservice Operations - Canned and dry productsUS Foodservice Operations - Fresh and frozen meatsUS Foodservice Operations - Frozen fruits, vegetables, bakery and otherUS Foodservice Operations - Dairy productsUS Foodservice Operations - PoultryUS Foodservice Operations - Fresh produceUS Foodservice Operations - Paper and disposablesInternational Foodservice Operations - Canned and dry productsInternational Foodservice Operations - Frozen fruits, vegetables, bakery and otherSygma Segment - Fresh and frozen meatsInternational Foodservice Operations - Fresh and frozen meatsUS Foodservice Operations - SeafoodInternational Foodservice Operations - Dairy productsUS Foodservice Operations - Beverage productsSygma Segment - Frozen fruits, vegetables, bakery and otherSygma Segment - PoultryUS Foodservice Operations - Equipment and smallwaresInternational Foodservice Operations - PoultryUS Foodservice Operations - OtherInternational Foodservice Operations - Fresh produceSygma Segment - Canned and dry productsInternational Foodservice Operations - OtherSygma Segment - Paper and disposablesInternational Foodservice Operations - Beverage productsSygma Segment - Beverage productsSygma Segment - Dairy productsInternational Foodservice Operations - Paper and disposablesInternational Foodservice Operations - SeafoodSygma Segment - Fresh produceInternational Foodservice Operations - Equipment and smallwaresSygma Segment - SeafoodSygma Segment - OtherSygma Segment - Equipment and smallwaresOther - Equipment and smallwaresOther - OtherOther - Beverage productsOther - Paper and disposablesSalesGross profitCost of salesOperating incomeTotal operating expensesOperating expensesEarnings before income taxesOther income (expense), net (calculated)Net earningsIncome taxesEarnings before income taxesEarnings beforeincome taxes$1.70 BSalesSales$60.23 BGross profitGross profit$10.98 BOperating incomeOperating income$2.20 BNet earningsNet earnings$1.30 BUS Foodservice Operations - Canned and dry productsUS Foodservice Operations- Canned and dry products$7.85 BTotal operating expensesTotal operatingexpenses$8.78 BIncome taxesIncome taxes$402.00 MUS Foodservice Operations - Fresh and frozen meatsUS Foodservice Operations- Fresh and frozen meats$7.85 BCost of salesCost of sales$49.25 BOperating expensesOperating expenses$8.78 BOther income (expense), net (calculated)Other income,net (calculated)−$501.00 MUS Foodservice Operations - Frozen fruits, vegetables, bakery and otherUS Foodservice Operations - Frozenfruits, vegetables, bakery and other$6.06 BUS Foodservice Operations - Dairy productsUS Foodservice Operations- Dairy products$4.79 BUS Foodservice Operations - PoultryUS Foodservice Operations - Poultry$4.32 BUS Foodservice Operations - Fresh produceUS Foodservice Operations- Fresh produce$3.92 BUS Foodservice Operations - Paper and disposablesUS Foodservice Operations- Paper and disposables$3.05 BInternational Foodservice Operations - Canned and dry productsInternational Foodservice Operations- Canned and dry products$2.30 BInternational Foodservice Operations - Frozen fruits, vegetables, bakery and otherInternational FoodserviceOperations - Frozen fruits,vegetables, bakery and other$2.07 BSygma Segment - Fresh and frozen meatsSYGMA - Fresh and frozen meats$1.69 BInternational Foodservice Operations - Fresh and frozen meatsInternational FoodserviceOperations - Fresh and frozen meats$1.62 BUS Foodservice Operations - SeafoodUS Foodservice Operations - Seafood$1.58 BInternational Foodservice Operations - Dairy productsInternational FoodserviceOperations - Dairy products$1.25 BUS Foodservice Operations - Beverage productsUS Foodservice Operations- Beverage products$1.11 BSygma Segment - Frozen fruits, vegetables, bakery and otherSYGMA - Frozen fruits,vegetables, bakery and other$1.02 BSygma Segment - PoultrySYGMA - Poultry$870.00 MUS Foodservice Operations - Equipment and smallwaresUS Foodservice Operations- Equipment and smallwares$847.00 MInternational Foodservice Operations - PoultryInternational FoodserviceOperations - Poultry$836.00 MUS Foodservice Operations - OtherUS Foodservice Operations - Other$833.00 MInternational Foodservice Operations - Fresh produceInternational FoodserviceOperations - Fresh produce$823.00 MSygma Segment - Canned and dry productsSYGMA - Canned and dry products$750.00 MInternational Foodservice Operations - OtherInternational FoodserviceOperations - Other$682.00 MSygma Segment - Paper and disposablesSYGMA - Paper and disposables$597.00 MInternational Foodservice Operations - Beverage productsInternational FoodserviceOperations - Beverage products$545.00 MSygma Segment - Beverage productsSYGMA - Beverage products$461.00 MSygma Segment - Dairy productsSYGMA - Dairy products$420.00 MInternational Foodservice Operations - Paper and disposablesInternational FoodserviceOperations - Paper and disposables$392.00 MInternational Foodservice Operations - SeafoodInternational FoodserviceOperations - Seafood$313.00 MSygma Segment - Fresh produceSYGMA - Fresh produce$220.00 MInternational Foodservice Operations - Equipment and smallwaresInternational Foodservice Operations- Equipment and smallwares$150.00 MSygma Segment - SeafoodSYGMA - Seafood$119.00 MSygma Segment - OtherSYGMA - Other$65.00 MSygma Segment - Equipment and smallwaresSYGMA - Equipment and smallwares$42.00 MOther - Equipment and smallwaresOther - Equipment and smallwares$363.00 MOther - OtherOther - Other$341.00 MOther - Beverage productsOther - Beverage products$60.00 MOther - Paper and disposablesOther - Paper and disposables$38.00 M
Chart details

Sysco Corporation (SYY) FY2025 YTD Q3 P&L / Income Statement

Income statement for 2024-06-30 through 2025-03-29. View: Segments by Product and Service. Revenue uses this breakdown; costs and expenses retain the consolidated categories.

Sales
60,232,000,000 US dollars
Cost of sales
49,249,000,000 US dollars
Gross profit
10,983,000,000 US dollars
Total operating expenses
8,783,000,000 US dollars
Operating income
2,200,000,000 US dollars
Other income (expense), net (calculated)
negative 501,000,000 US dollars
Earnings before income taxes
1,699,000,000 US dollars
Income taxes
402,000,000 US dollars
Net earnings
1,297,000,000 US dollars
International Foodservice Operations - Beverage products
545,000,000 US dollars
International Foodservice Operations - Canned and dry products
2,300,000,000 US dollars
International Foodservice Operations - Dairy products
1,249,000,000 US dollars
International Foodservice Operations - Equipment and smallwares
150,000,000 US dollars
International Foodservice Operations - Fresh and frozen meats
1,620,000,000 US dollars
International Foodservice Operations - Fresh produce
823,000,000 US dollars
International Foodservice Operations - Frozen fruits, vegetables, bakery and other
2,068,000,000 US dollars
International Foodservice Operations - Other
682,000,000 US dollars
International Foodservice Operations - Paper and disposables
392,000,000 US dollars
International Foodservice Operations - Poultry
836,000,000 US dollars
International Foodservice Operations - Seafood
313,000,000 US dollars
Sygma Segment - Beverage products
461,000,000 US dollars
Sygma Segment - Canned and dry products
750,000,000 US dollars
Sygma Segment - Dairy products
420,000,000 US dollars
Sygma Segment - Equipment and smallwares
42,000,000 US dollars
Sygma Segment - Fresh and frozen meats
1,687,000,000 US dollars
Sygma Segment - Fresh produce
220,000,000 US dollars
Sygma Segment - Frozen fruits, vegetables, bakery and other
1,015,000,000 US dollars
Sygma Segment - Other
65,000,000 US dollars
Sygma Segment - Paper and disposables
597,000,000 US dollars
Sygma Segment - Poultry
870,000,000 US dollars
Sygma Segment - Seafood
119,000,000 US dollars
US Foodservice Operations - Beverage products
1,113,000,000 US dollars
US Foodservice Operations - Canned and dry products
7,847,000,000 US dollars
US Foodservice Operations - Dairy products
4,794,000,000 US dollars
US Foodservice Operations - Equipment and smallwares
847,000,000 US dollars
US Foodservice Operations - Fresh and frozen meats
7,846,000,000 US dollars
US Foodservice Operations - Fresh produce
3,915,000,000 US dollars
US Foodservice Operations - Frozen fruits, vegetables, bakery and other
6,063,000,000 US dollars
US Foodservice Operations - Other
833,000,000 US dollars
US Foodservice Operations - Paper and disposables
3,048,000,000 US dollars
US Foodservice Operations - Poultry
4,316,000,000 US dollars
US Foodservice Operations - Seafood
1,584,000,000 US dollars
Other - Beverage products
60,000,000 US dollars
Other - Canned and dry products
0 US dollars
Other - Dairy products
0 US dollars
Other - Equipment and smallwares
363,000,000 US dollars
Other - Fresh and frozen meats
0 US dollars
Other - Fresh produce
0 US dollars
Other - Frozen fruits, vegetables, bakery and other
0 US dollars
Other - Other
341,000,000 US dollars
Other - Paper and disposables
38,000,000 US dollars
Other - Poultry
0 US dollars
Other - Seafood
0 US dollars
Operating expenses
8,783,000,000 US dollars

Chart connections

  • Revenue less cost of revenue equals gross profit; gross profit less operating expenses equals operating income.
  • Operating income plus other income or expense equals income before tax. Income before tax less income tax expense or benefit equals net income.
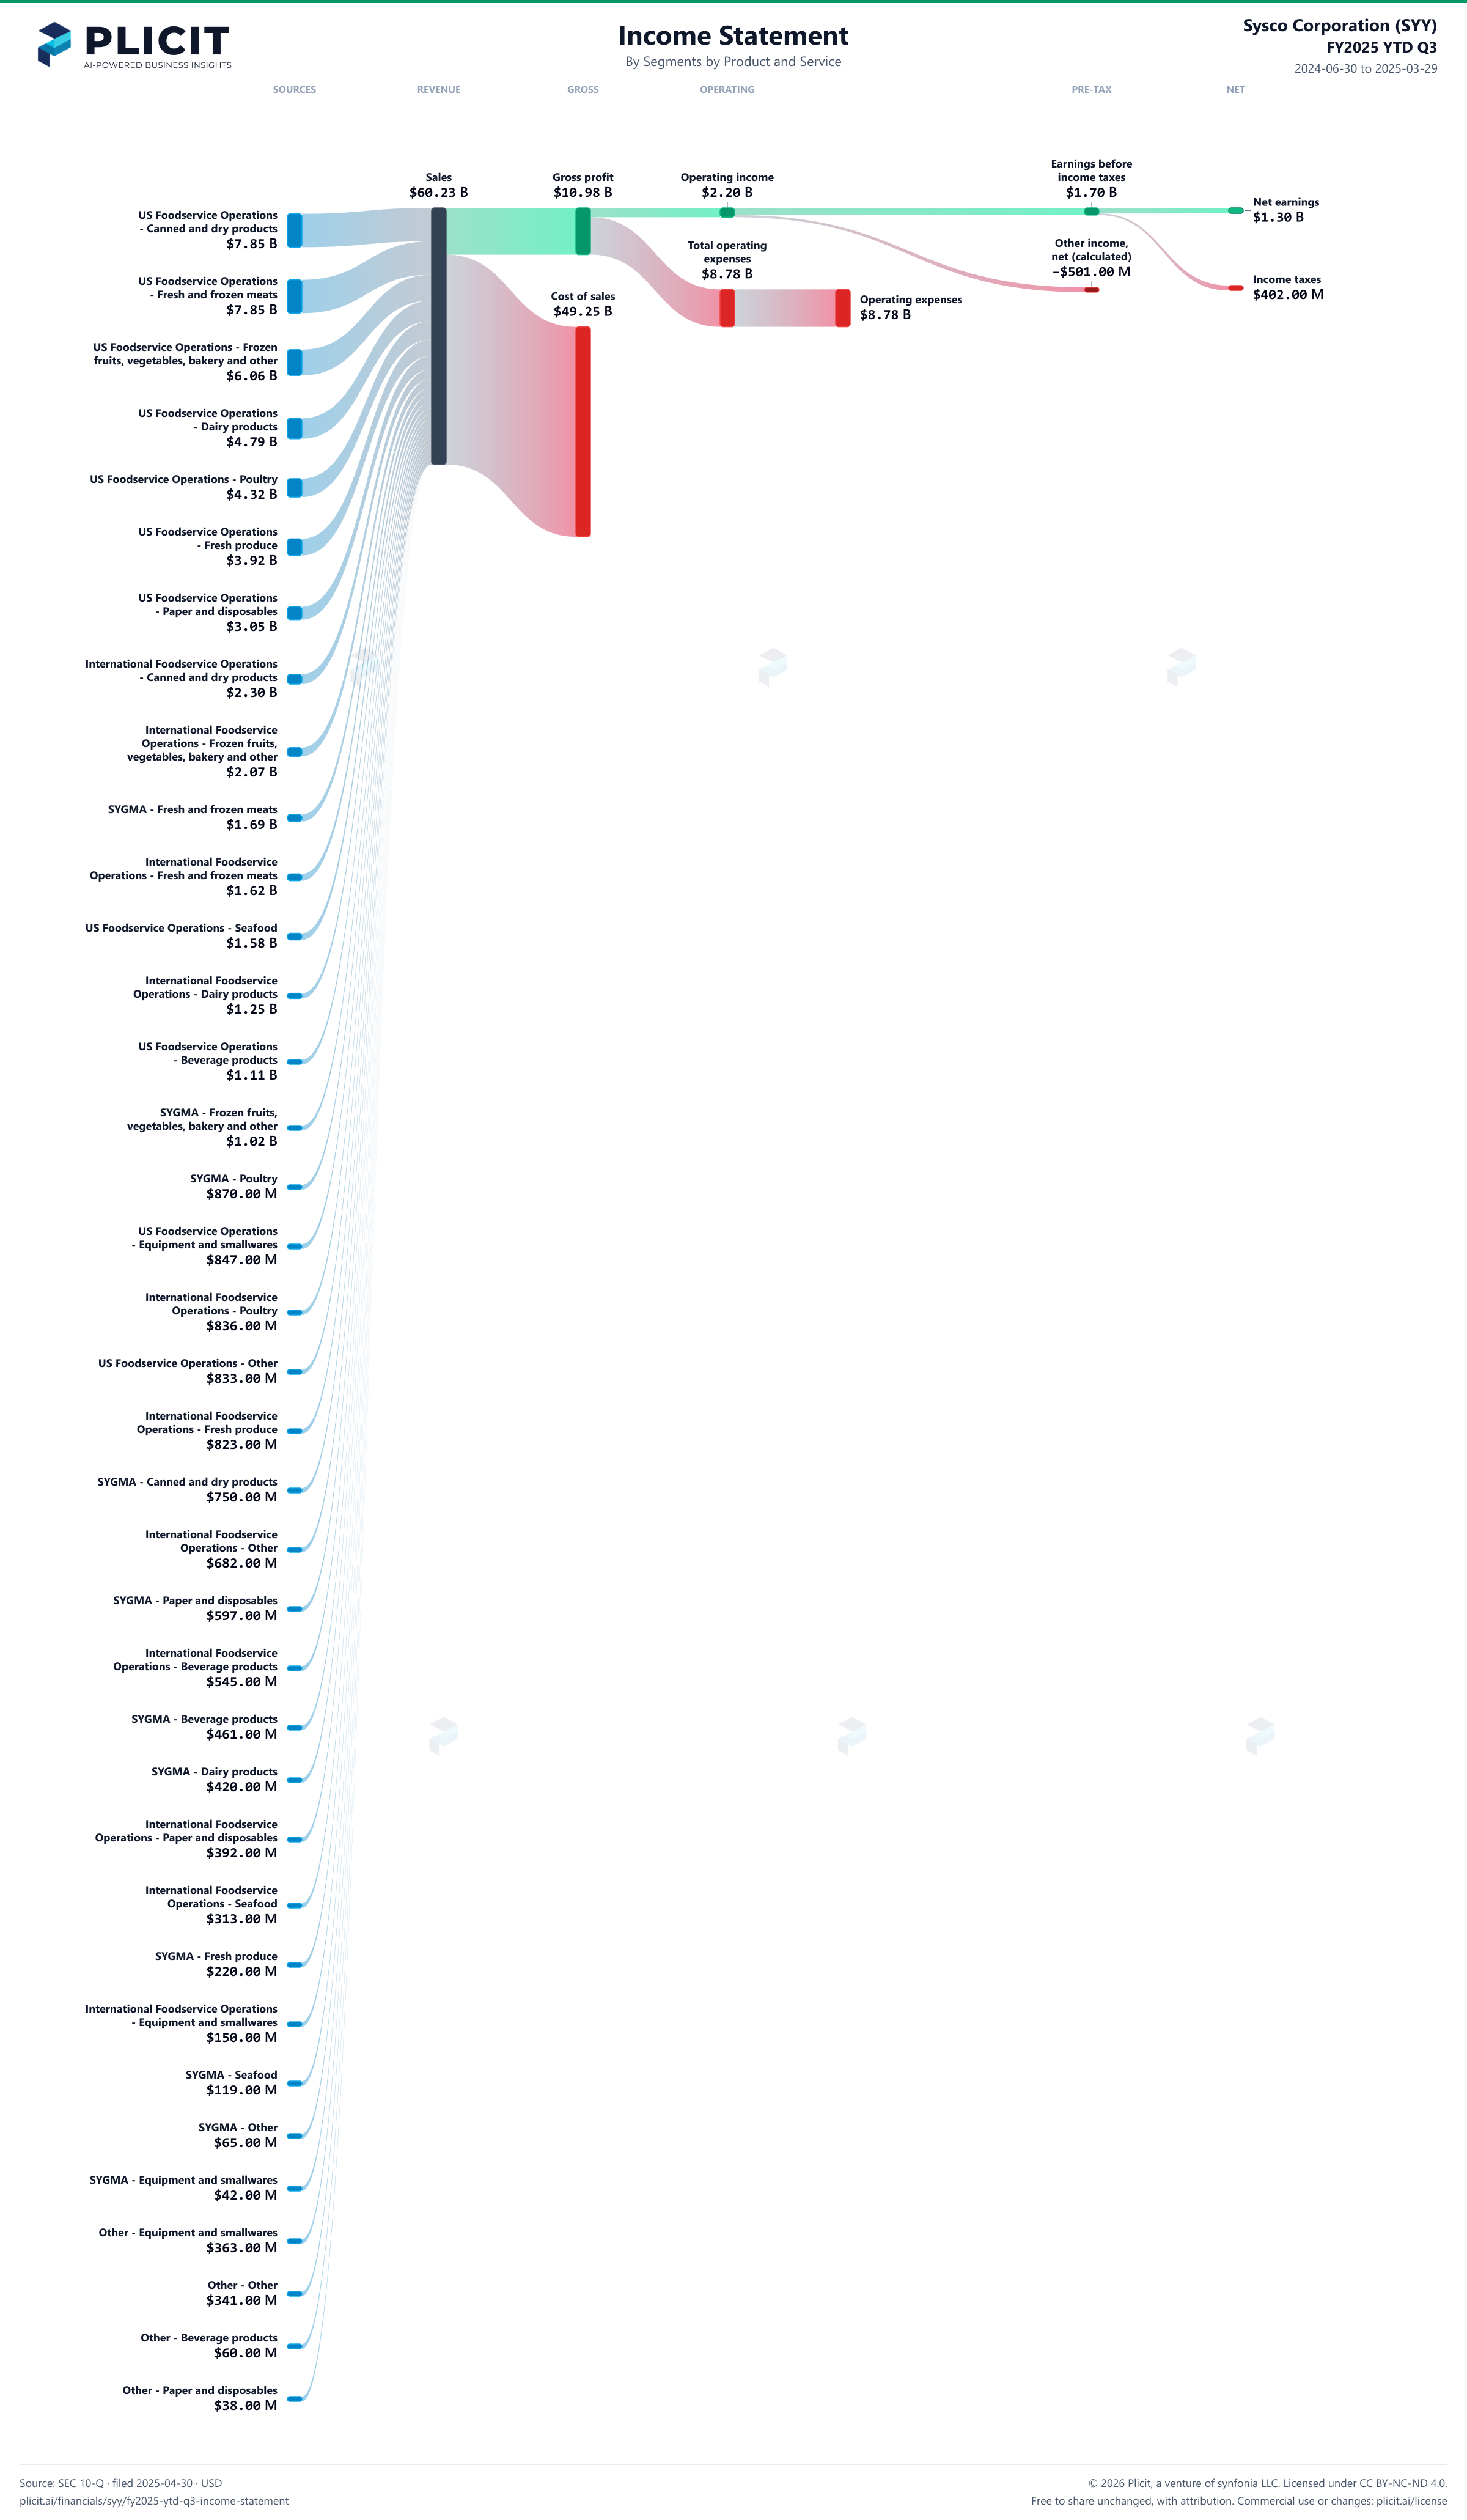
Sysco Corporation (SYY) FY2025 YTD Q3 Revenue by Business Segment by Product and Service Sankey chart
Free to share unchanged, with credit to Plicit.ai · CC BY-NC-ND 4.0Download PNG

Gross margin

18.2%

Gross profit / revenue

Operating margin

3.7%

Operating profit / revenue

Cash conversion

101.5%

Operating cash / net income, same period

Newsletter

Get the teardowns by email

Subscribe if you want the public-company teardowns in your inbox when they're released.

Product waitlist

Health Check and Teardown for your own company

A health check uncovers insights of your private books, not a public ticker. Join this list to get notified as soon as we go-live!