
Waystar Holding Corp. (WAY) FY2026 YTD Q2 P&L / Income Statement

P&L / Income Statement

2026-01-01 to 2026-06-30

Swipe to see the full flow
Waystar Holding Corp. (WAY) FY2026 YTD Q2 P&L / Income StatementIncome statement for 2026-01-01 through 2026-06-30. View: Product and Service by Health Care Organization, Revenue Sources. Revenue uses this breakdown; costs and expenses retain the consolidated categories.SOURCESREVENUEGROSSOPERATINGPRE-TAXNETSubscription revenue - ProviderVolume-based revenue - PatientVolume-based revenue - ProviderSubscription revenue - PatientImplementation services and other revenue - ProviderImplementation services and other revenue - PatientRevenueGross profit (calculated)Cost of revenue (calculated)Cost of revenue (exclusive of depreciation and amortization expenses)Income from operationsOperating expenses (calculated)Sales and marketingDepreciation and amortizationGeneral and administrativeResearch and developmentIncome before income taxesOther income (expense), net (calculated)Net incomeIncome tax expenseGross profit (calculated)Gross profit(calculated)$438.83 MRevenueRevenue$633.55 MIncome from operationsIncome from operations$156.51 MIncome before income taxesPretax income$116.21 MNet incomeNet income$84.15 MSubscription revenue - ProviderSubscription revenue - Provider$341.56 MOperating expenses (calculated)Operating expenses(calculated)$282.32 MIncome tax expenseIncome tax expense$32.06 MSales and marketingSales and marketing$96.21 MOther income (expense), net (calculated)Other income,net (calculated)−$40.29 MVolume-based revenue - PatientVolume-based revenue - Patient$162.98 MDepreciation and amortizationDepreciation and amortization$82.92 MCost of revenue (calculated)Cost of revenue(calculated)$194.72 MGeneral and administrativeGeneral and administrative$67.10 MVolume-based revenue - ProviderVolume-based revenue - Provider$118.63 MResearch and developmentResearch and development$36.09 MSubscription revenue - PatientSubscription revenue - Patient$6.89 MCost of revenue (exclusive of depreciation and amortization expenses)Cost of revenue$194.72 MImplementation services and other revenue - ProviderImplementation servicesand other revenue - Provider$1.87 MImplementation services and other revenue - PatientImplementation servicesand other revenue - Patient$1.61 M
Chart details

Waystar Holding Corp. (WAY) FY2026 YTD Q2 P&L / Income Statement

Income statement for 2026-01-01 through 2026-06-30. View: Product and Service by Health Care Organization, Revenue Sources. Revenue uses this breakdown; costs and expenses retain the consolidated categories.

Revenue
633,548,000 US dollars
Cost of revenue (calculated)
194,721,000 US dollars
Gross profit (calculated)
438,827,000 US dollars
Operating expenses (calculated)
282,320,000 US dollars
Income from operations
156,507,000 US dollars
Other income (expense), net (calculated)
negative 40,293,000 US dollars
Income before income taxes
116,214,000 US dollars
Income tax expense
32,064,000 US dollars
Net income
84,150,000 US dollars
Subscription revenue - Patient
6,893,000 US dollars
Subscription revenue - Provider
341,564,000 US dollars
Implementation services and other revenue - Patient
1,612,000 US dollars
Implementation services and other revenue - Provider
1,869,000 US dollars
Volume-based revenue - Patient
162,977,000 US dollars
Volume-based revenue - Provider
118,633,000 US dollars
Cost of revenue (exclusive of depreciation and amortization expenses)
194,721,000 US dollars
Sales and marketing
96,209,000 US dollars
General and administrative
67,102,000 US dollars
Research and development
36,091,000 US dollars
Depreciation and amortization
82,918,000 US dollars

Chart connections

  • Revenue less cost of revenue equals gross profit; gross profit less operating expenses equals operating income.
  • Operating income plus other income or expense equals income before tax. Income before tax less income tax expense or benefit equals net income.
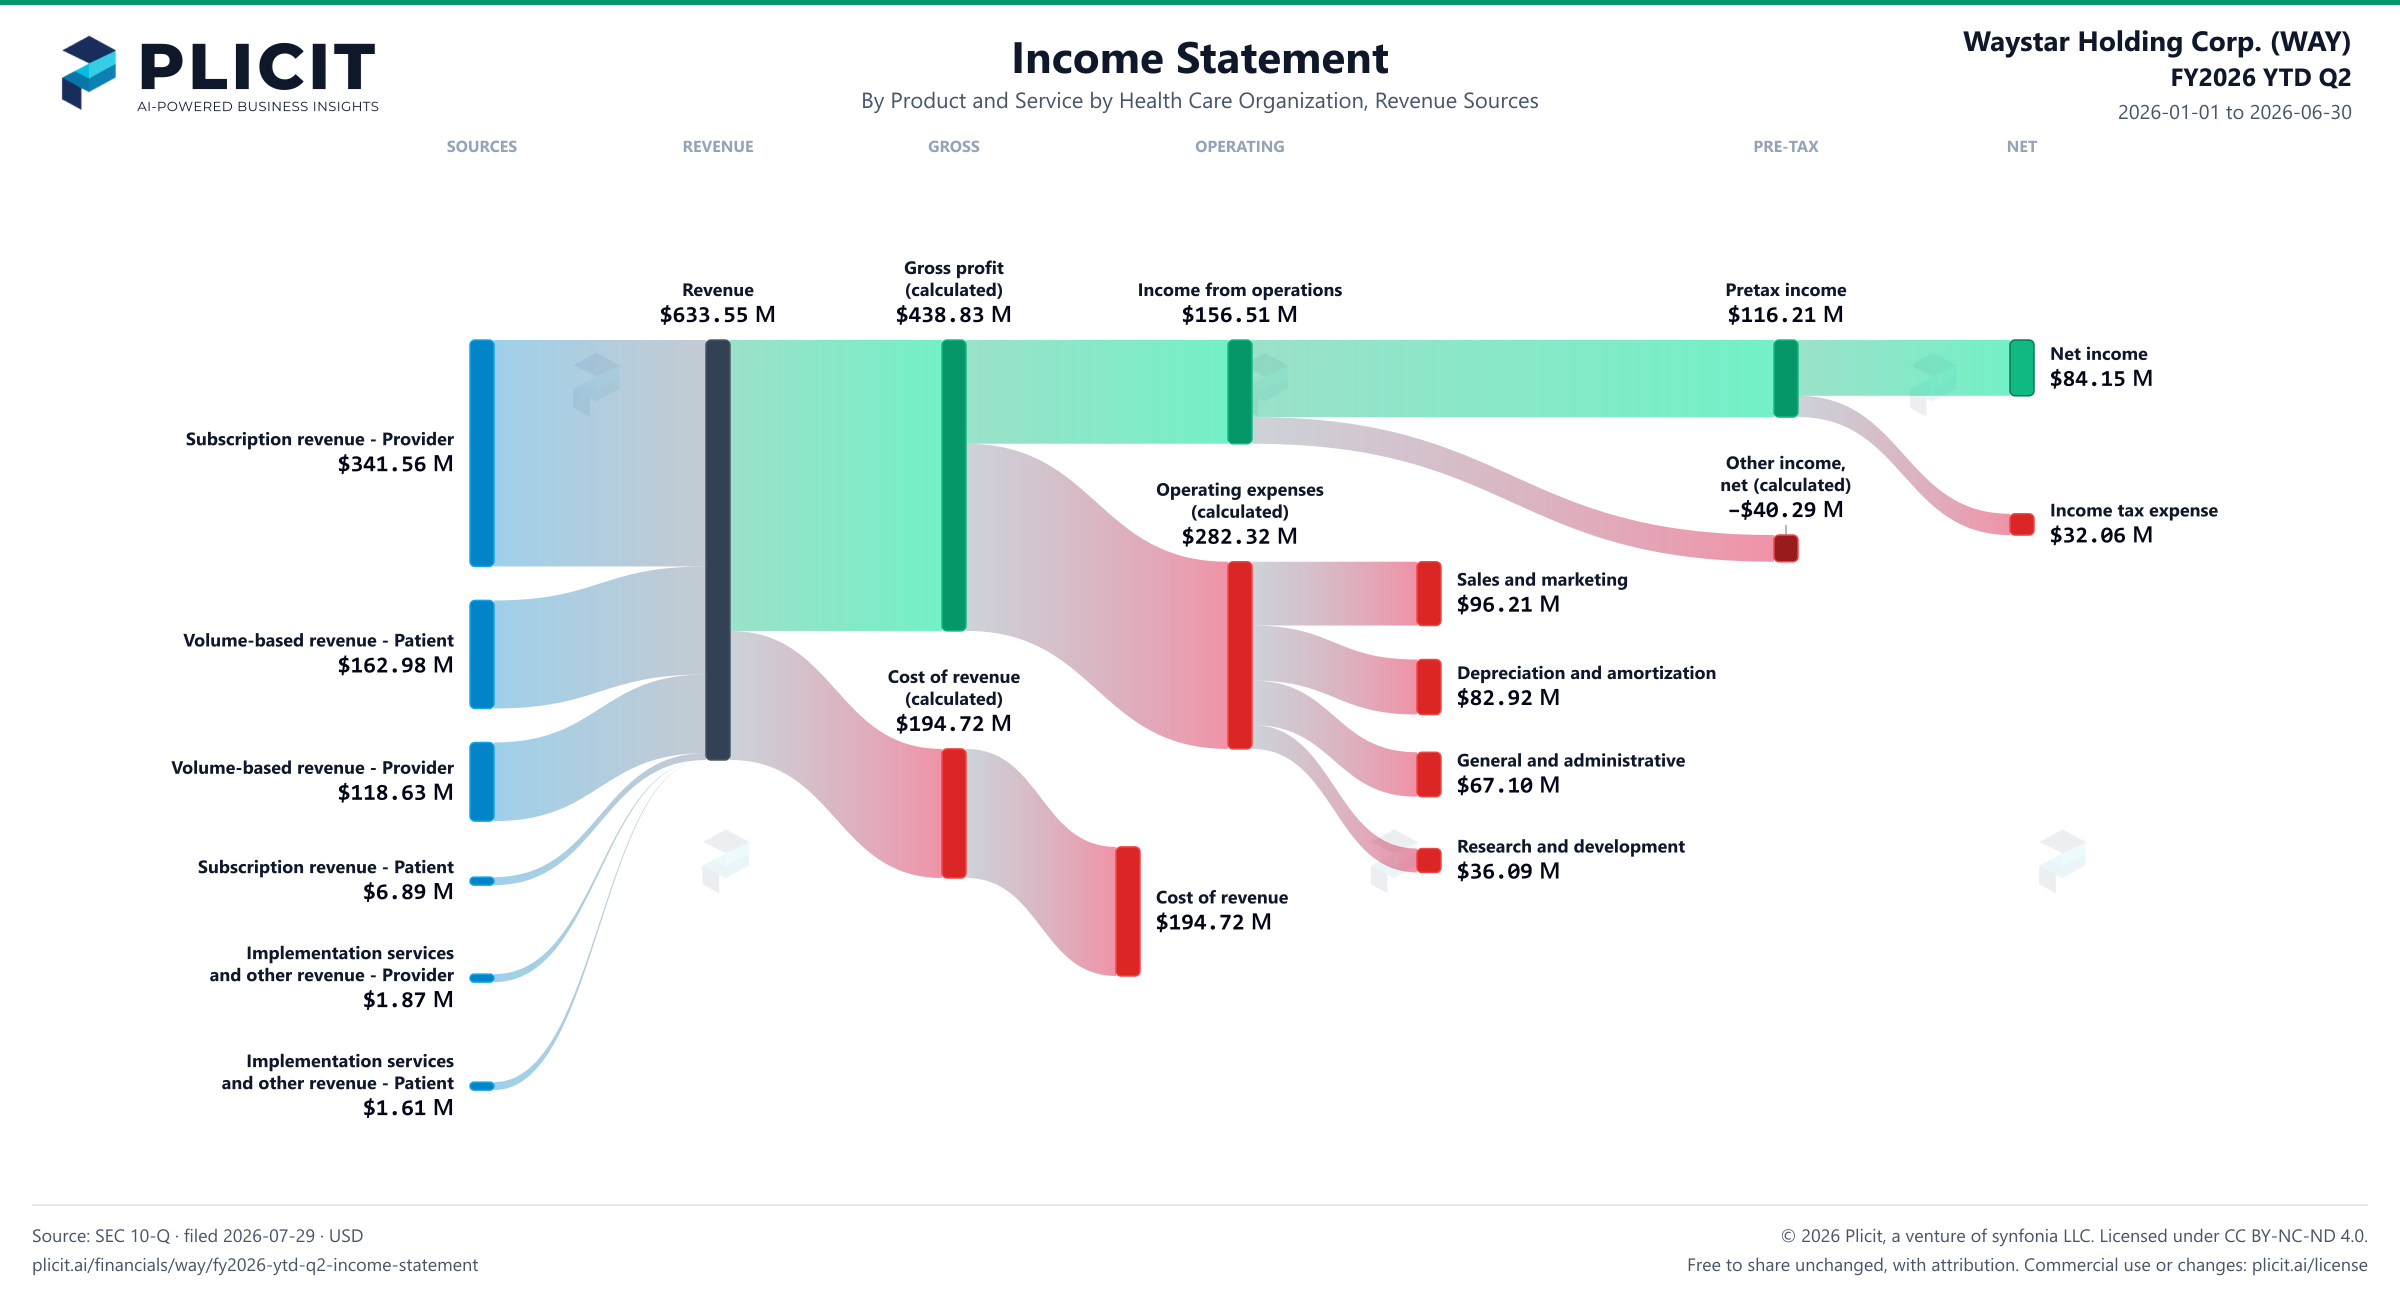
Waystar Holding Corp. (WAY) FY2026 YTD Q2 P&L / Income Statement Sankey chart, Product and service — Product and Service by Health Care Organization, Revenue Sources view
Free to share unchanged, with credit to Plicit.ai · CC BY-NC-ND 4.0Download PNG

Gross margin

69.3%

Gross profit / revenue

Operating margin

24.7%

Operating profit / revenue

Cash conversion

171.5%

Operating cash / net income, same period

Newsletter

Get the teardowns by email

Subscribe if you want the public-company teardowns in your inbox when they're released.

Product waitlist

Health Check and Teardown for your own company

A health check uncovers insights of your private books, not a public ticker. Join this list to get notified as soon as we go-live!