
ZIFF DAVIS, INC. (ZD) FY2026 Q2 P&L / Income Statement

Revenue by Business Segment by Product and Service

2026-04-01 to 2026-06-30

Swipe to see the full flow
ZIFF DAVIS, INC. (ZD) FY2026 Q2 P&L / Income StatementIncome statement for 2026-04-01 through 2026-06-30. View: Segments by Product and Service. Revenue uses this breakdown; costs and expenses retain the consolidated categories.SOURCESREVENUEGROSSOPERATINGPRE-TAXNETHealth & Wellness - Advertising and performance marketingTechnology & Shopping - Advertising and performance marketingCybersecurity & Martech - Subscription and licensingGaming & Entertainment - Advertising and performance marketingGaming & Entertainment - Subscription and licensingHealth & Wellness - Subscription and licensingTechnology & Shopping - Subscription and licensingCybersecurity & Martech - OtherHealth & Wellness - OtherGaming & Entertainment - OtherTechnology & Shopping - OtherTotal revenuesGross profit (calculated)Direct costsOperating (loss) incomeOperating expenses (calculated)Sales and marketingGoodwill impairmentDepreciation and amortizationResearch, development, and engineeringGeneral, administrative, and other related costs(Loss) income from continuing operations before income tax expense and income from equity method investmentOther income (expense), net (calculated)Net incomeIncome tax (expense) benefit(Loss) income from equity method investment, net of taxNet income from discontinued operations, net of taxGross profit (calculated)Gross profit(calculated)$241.03 MOperating (loss) incomeOperating(loss) income−$44.72 MTotal revenuesTotal revenues$286.74 M(Loss) income from continuing operations before income tax expense and income from equity method investmentPretax income−$51.08 MHealth & Wellness - Advertising and performance marketingHealth & Wellness - Advertisingand performance marketing$79.79 MOperating expenses (calculated)Operating expenses(calculated)$285.75 MTechnology & Shopping - Advertising and performance marketingTechnology & Shopping - Advertisingand performance marketing$73.10 MSales and marketingSales and marketing$122.17 MNet incomeNet income$624.46 MDirect costsDirect costs$45.71 MCybersecurity & Martech - Subscription and licensingCybersecurity & Martech -Subscription and licensing$65.74 MGoodwill impairmentGoodwill impairment$54.84 MGaming & Entertainment - Advertising and performance marketingGaming & Entertainment - Advertisingand performance marketing$29.17 MDepreciation and amortizationDepreciation and amortization$46.87 MResearch, development, and engineeringResearch, development,and engineering$14.37 MGaming & Entertainment - Subscription and licensingGaming & Entertainment -Subscription and licensing$16.27 MOther income (expense), net (calculated)Other income,net (calculated)−$6.36 MIncome tax (expense) benefitIncome tax(expense) benefit$941.00 KGeneral, administrative, and other related costsGeneral, administrative,and other related costs$47.50 MHealth & Wellness - Subscription and licensingHealth & Wellness -Subscription and licensing$12.80 M(Loss) income from equity method investment, net of tax(Loss) incomefrom equity methodinvestment, net of tax−$133.00 KTechnology & Shopping - Subscription and licensingTechnology & Shopping -Subscription and licensing$3.59 MCybersecurity & Martech - OtherCybersecurity & Martech - Other$2.97 MHealth & Wellness - OtherHealth & Wellness - Other$2.07 MNet income from discontinued operations, net of taxNet income fromdiscontinuedoperations, net of tax$676.61 MGaming & Entertainment - OtherGaming & Entertainment - Other$1.19 MTechnology & Shopping - OtherTechnology & Shopping - Other$66.00 K
Chart details

ZIFF DAVIS, INC. (ZD) FY2026 Q2 P&L / Income Statement

Income statement for 2026-04-01 through 2026-06-30. View: Segments by Product and Service. Revenue uses this breakdown; costs and expenses retain the consolidated categories.

Total revenues
286,738,000 US dollars
Direct costs
45,711,000 US dollars
Gross profit (calculated)
241,027,000 US dollars
Operating expenses (calculated)
285,750,000 US dollars
Operating (loss) income
negative 44,723,000 US dollars
Other income (expense), net (calculated)
negative 6,356,000 US dollars
(Loss) income from continuing operations before income tax expense and income from equity method investment
negative 51,079,000 US dollars
Income tax (expense) benefit
941,000 US dollars
Net income
624,461,000 US dollars
Cybersecurity & Martech - Other
2,965,000 US dollars
Cybersecurity & Martech - Subscription and licensing
65,739,000 US dollars
Gaming & Entertainment - Advertising and performance marketing
29,167,000 US dollars
Gaming & Entertainment - Other
1,187,000 US dollars
Gaming & Entertainment - Subscription and licensing
16,265,000 US dollars
Health & Wellness - Advertising and performance marketing
79,791,000 US dollars
Health & Wellness - Other
2,065,000 US dollars
Health & Wellness - Subscription and licensing
12,802,000 US dollars
Technology & Shopping - Advertising and performance marketing
73,098,000 US dollars
Technology & Shopping - Other
66,000 US dollars
Technology & Shopping - Subscription and licensing
3,593,000 US dollars
Sales and marketing
122,172,000 US dollars
Research, development, and engineering
14,369,000 US dollars
General, administrative, and other related costs
47,496,000 US dollars
Depreciation and amortization
46,874,000 US dollars
Goodwill impairment
54,839,000 US dollars
(Loss) income from equity method investment, net of tax
negative 133,000 US dollars. Reported below-tax contribution to net income.
Net income from discontinued operations, net of tax
676,614,000 US dollars. Reported below-tax contribution to net income.

Chart connections

  • Revenue less cost of revenue equals gross profit; gross profit less operating expenses equals operating income.
  • Operating income plus other income or expense equals income before tax. Income before tax less income tax expense or benefit, plus the explicitly reported below-tax contributions, equals net income.
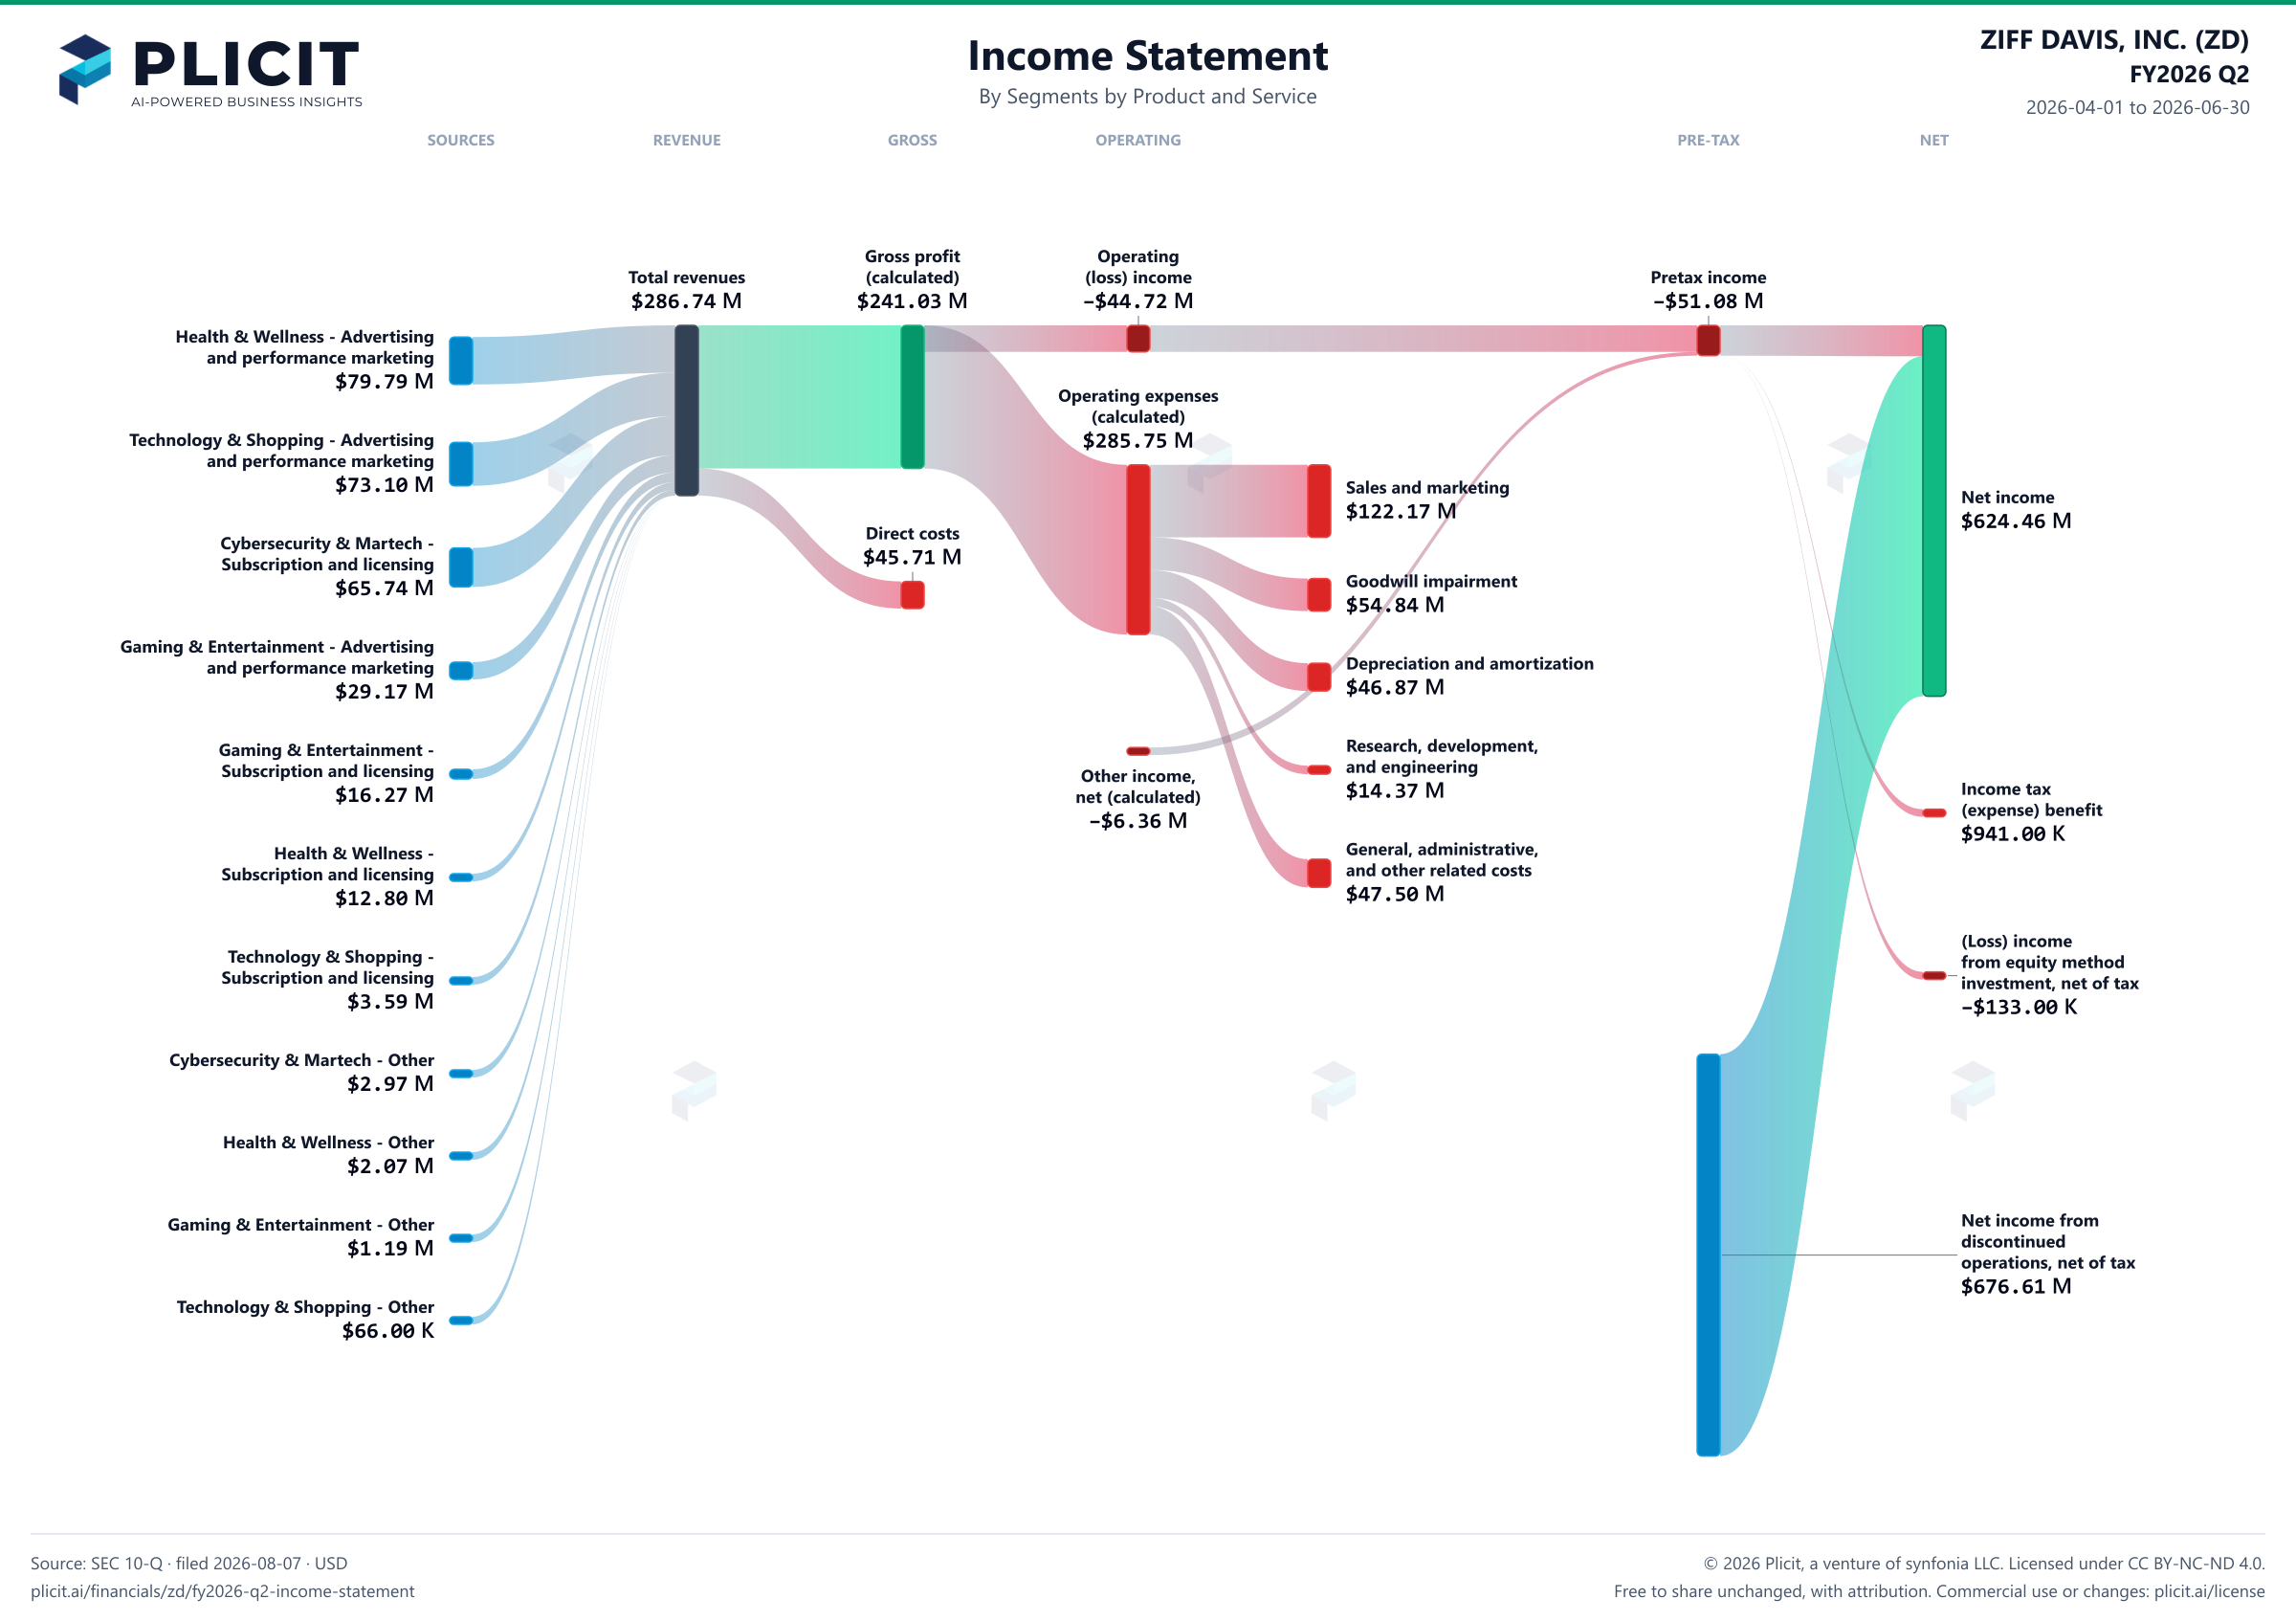
ZIFF DAVIS, INC. (ZD) FY2026 Q2 P&L / Income Statement Sankey chart, Segments by Product and Service view
Free to share unchanged, with credit to Plicit.ai · CC BY-NC-ND 4.0Download PNG

Gross margin

84.1%

Gross profit / revenue

Operating margin

−15.6%

Operating profit / revenue

Cash conversion

14.2%

Operating cash / net income, same period

Newsletter

Get the teardowns by email

Subscribe if you want the public-company teardowns in your inbox when they're released.

Product waitlist

Health Check and Teardown for your own company

A health check uncovers insights of your private books, not a public ticker. Join this list to get notified as soon as we go-live!