
AAON, INC. (AAON) FY2026 Q2 Balance Sheet

Balance Sheet

As of 2026-06-30

Swipe to see the full flow
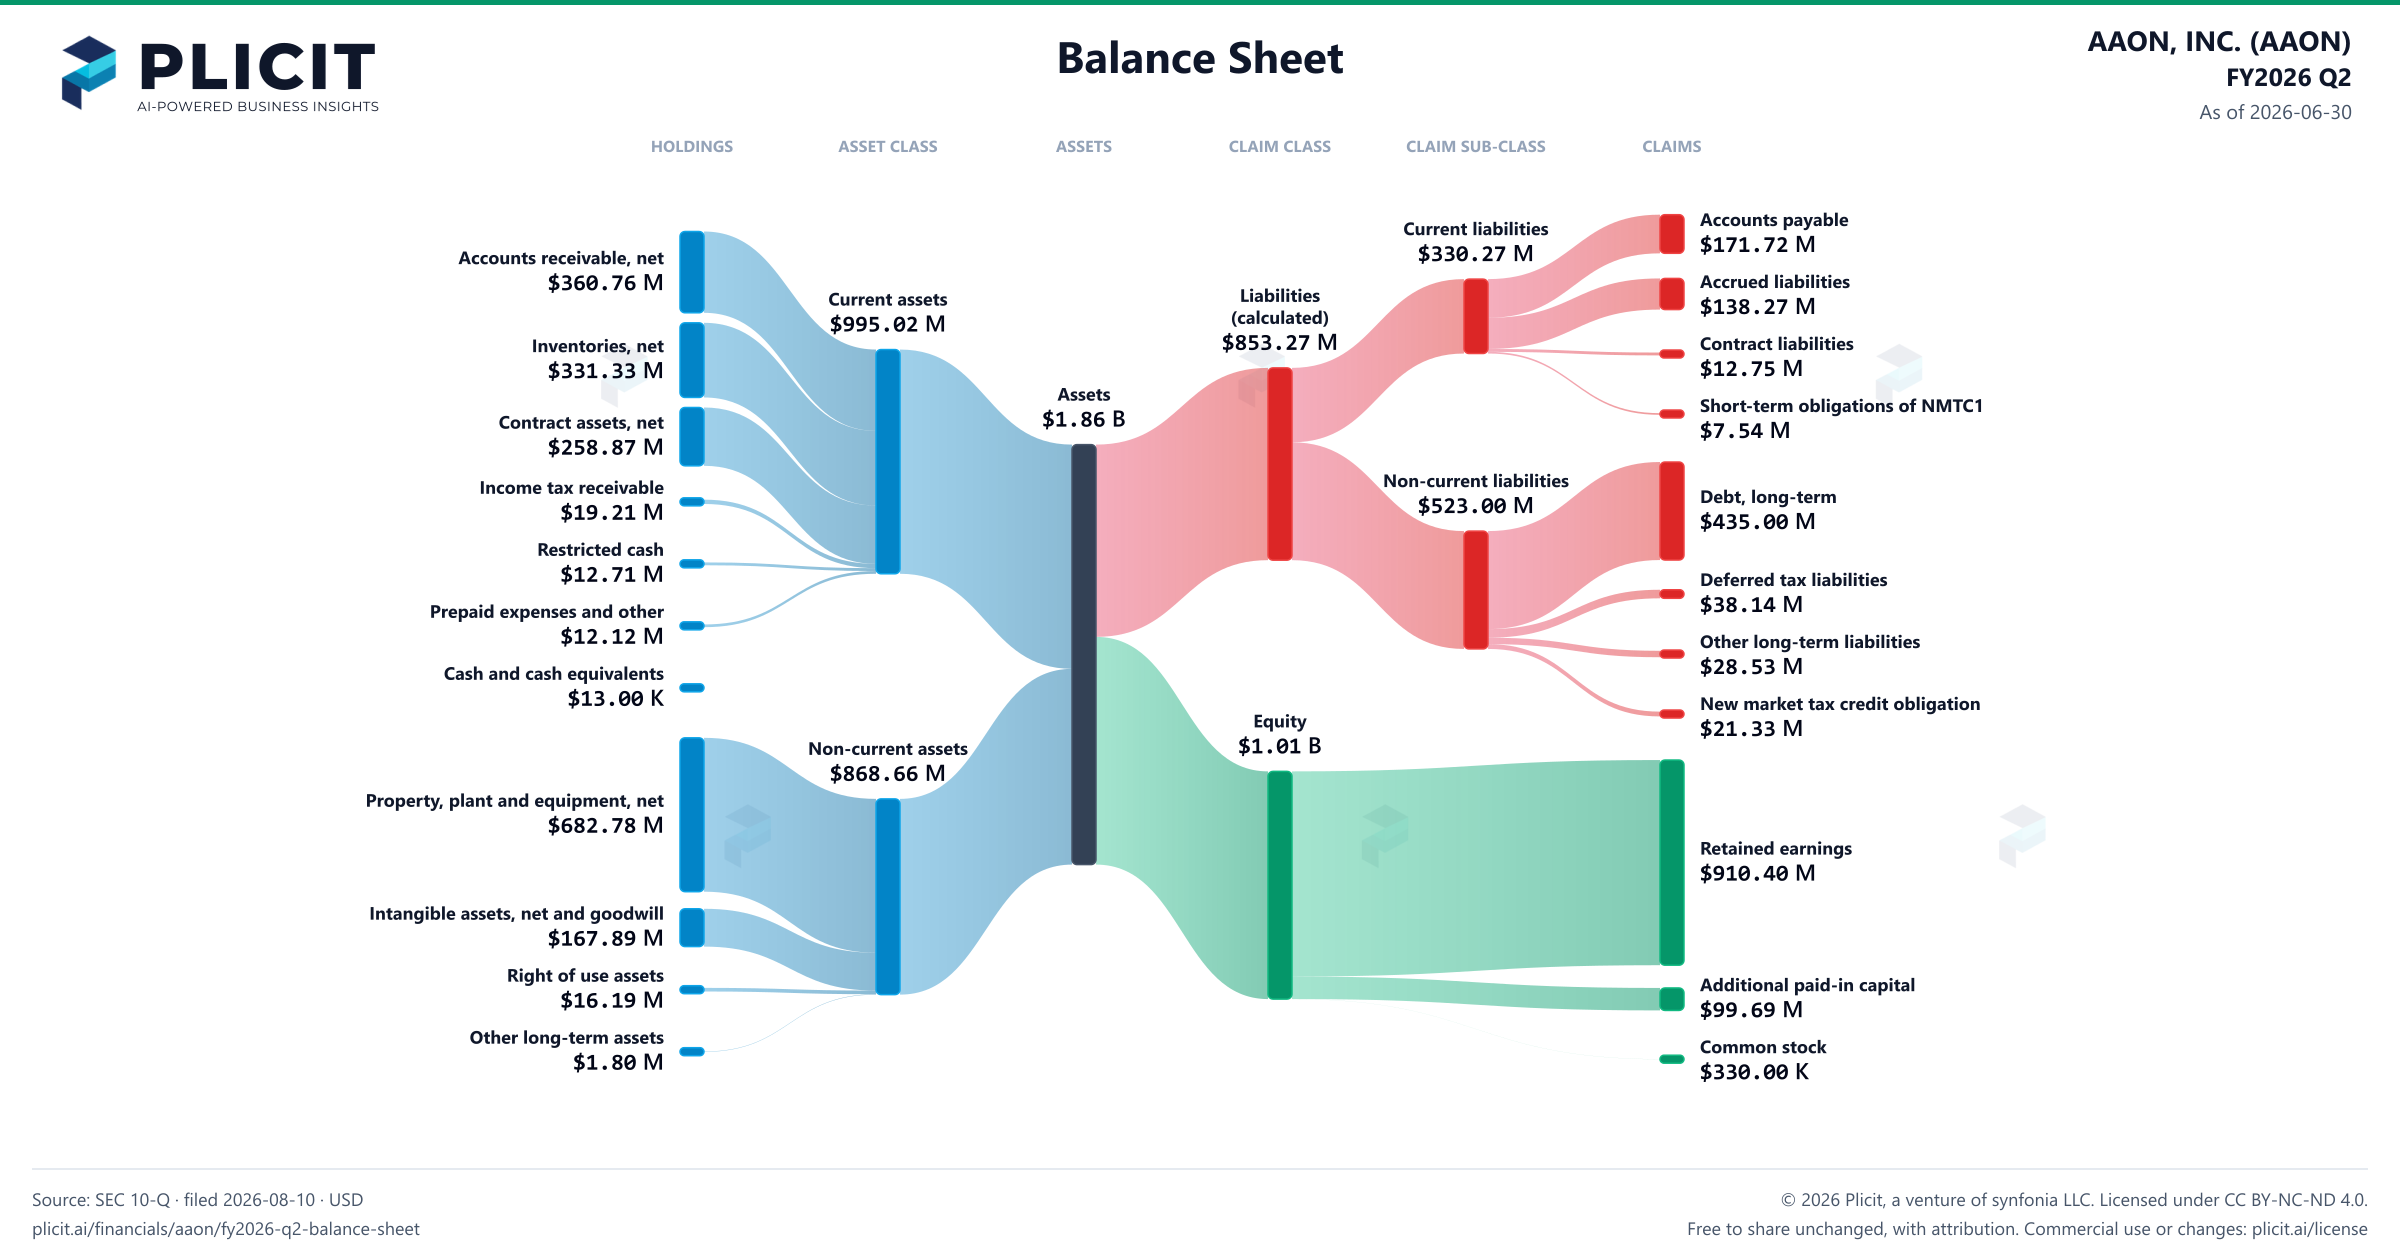
AAON, INC. (AAON) FY2026 Q2 Balance SheetBalance sheet as of 2026-06-30. The chart shows assets, liabilities and equity at that date.Current liabilities$330.27 MLiabilities(calculated)$853.27 MCurrent assets$995.02 MAssets$1.86 BNon-current liabilities$523.00 MEquity$1.01 BNon-current assets$868.66 MHOLDINGSASSET CLASSASSETSCLAIM CLASSCLAIM SUB-CLASSCLAIMSAccounts receivable, netInventories, netContract assets, netIncome tax receivableRestricted cashPrepaid expenses and otherCash and cash equivalentsProperty, plant and equipment, netIntangible assets, net and goodwillRight of use assetsOther long-term assetsAccounts payableAccrued liabilitiesContract liabilitiesShort-term obligations of NMTC1Debt, long-termDeferred tax liabilitiesOther long-term liabilitiesNew market tax credit obligationRetained earningsAdditional paid-in capitalCommon stockCurrent assetsNon-current assetsAssetsCurrent liabilitiesNon-current liabilitiesLiabilities (calculated)EquityAccounts payableAccounts payable$171.72 MCurrent liabilitiesCurrent liabilities$330.27 MAccounts receivable, netAccounts receivable, net$360.76 MAccrued liabilitiesAccrued liabilities$138.27 MLiabilities (calculated)Liabilities(calculated)$853.27 MCurrent assetsCurrent assets$995.02 MContract liabilitiesContract liabilities$12.75 MInventories, netInventories, net$331.33 MAssetsAssets$1.86 BShort-term obligations of NMTC1Short-term obligations of NMTC1$7.54 MContract assets, netContract assets, net$258.87 MNon-current liabilitiesNon-current liabilities$523.00 MIncome tax receivableIncome tax receivable$19.21 MDebt, long-termDebt, long-term$435.00 MRestricted cashRestricted cash$12.71 MDeferred tax liabilitiesDeferred tax liabilities$38.14 MPrepaid expenses and otherPrepaid expenses and other$12.12 MOther long-term liabilitiesOther long-term liabilities$28.53 MCash and cash equivalentsCash and cash equivalents$13.00 KNew market tax credit obligationNew market tax credit obligation$21.33 MEquityEquity$1.01 BNon-current assetsNon-current assets$868.66 MProperty, plant and equipment, netProperty, plant and equipment, net$682.78 MRetained earningsRetained earnings$910.40 MIntangible assets, net and goodwillIntangible assets, net and goodwill$167.89 MRight of use assetsRight of use assets$16.19 MAdditional paid-in capitalAdditional paid-in capital$99.69 MOther long-term assetsOther long-term assets$1.80 MCommon stockCommon stock$330.00 K
Chart details

AAON, INC. (AAON) FY2026 Q2 Balance Sheet

Balance sheet as of 2026-06-30. The chart shows assets, liabilities and equity at that date.

Assets
1,863,683,000 US dollars
Current assets
995,020,000 US dollars
Non-current assets
868,663,000 US dollars
Liabilities (calculated)
853,267,000 US dollars
Current liabilities
330,271,000 US dollars
Non-current liabilities
522,996,000 US dollars
Equity
1,010,416,000 US dollars
Accounts receivable, net
360,763,000 US dollars
Inventories, net
331,328,000 US dollars
Contract assets, net
258,873,000 US dollars
Income tax receivable
19,212,000 US dollars
Restricted cash
12,714,000 US dollars
Prepaid expenses and other
12,117,000 US dollars
Cash and cash equivalents
13,000 US dollars
Property, plant and equipment, net
682,779,000 US dollars
Intangible assets, net and goodwill
167,893,000 US dollars
Right of use assets
16,190,000 US dollars
Other long-term assets
1,801,000 US dollars
Accounts payable
171,717,000 US dollars
Accrued liabilities
138,267,000 US dollars
Contract liabilities
12,752,000 US dollars
Short-term obligations of NMTC1
7,535,000 US dollars
Debt, long-term
435,000,000 US dollars
Deferred tax liabilities
38,136,000 US dollars
Other long-term liabilities
28,529,000 US dollars
New market tax credit obligation
21,331,000 US dollars
Retained earnings
910,397,000 US dollars
Additional paid-in capital
99,689,000 US dollars
Common stock
330,000 US dollars
Preferred stock
0 US dollars

Chart connections

  • Assets equal liabilities plus consolidated equity. Consolidated equity includes noncontrolling interests when reported.
  • Treasury shares and other negative equity contributions reduce equity.
AAON, INC. (AAON) FY2026 Q2 Balance Sheet Sankey chart
Free to share unchanged, with credit to Plicit.ai · CC BY-NC-ND 4.0Download PNG

Newsletter

Get the teardowns by email

Subscribe if you want the public-company teardowns in your inbox when they're released.

Product waitlist

Health Check and Teardown for your own company

A health check uncovers insights of your private books, not a public ticker. Join this list to get notified as soon as we go-live!