
AbbVie Inc. (ABBV) FY2025 Annual P&L / Income Statement

Revenue by Key Product Portfolio by Product and Service

2025-01-01 to 2025-12-31

Swipe to see the full flow
AbbVie Inc. (ABBV) FY2025 Annual P&L / Income StatementIncome statement for 2025-01-01 through 2025-12-31. View: Key Product Portfolio by Product and Service. Revenue uses this breakdown; costs and expenses retain the consolidated categories.SOURCESREVENUEGROSSOPERATINGPRE-TAXNETImmunology - SkyriziImmunology - RinvoqImmunology - HumiraUndisclosed (calculated)Neuroscience - Botox TherapeuticNeuroscience - VraylarOncology - ImbruvicaOncology - VenclextaAesthetics - Botox CosmeticNeuroscience - UbrelvyAesthetics - Other AestheticsNeuroscience - QuliptaEye Care - Other Eye CareAesthetics - Juvederm CollectionOncology - ElahereEye Care - OzurdexNeuroscience - VyalevEye Care - Lumigan/GanfortNeuroscience - DuodopaOncology - EpkinlyNeuroscience - Other NeuroscienceEye Care - Alphagan/CombiganOther Key Products - MavyretOther Key Products - Linzess/ConstellaNet revenuesGross profit (calculated)Cost of products soldOperating earningsOperating expenses (calculated)Selling, general and administrativeResearch and developmentAcquired IPR&D and milestonesOther operating incomeEarnings before income tax expenseOther income (expense), net (calculated)Net earningsIncome tax expense (benefit)Gross profit (calculated)Gross profit(calculated)$42.96 BEarnings before income tax expenseEarnings beforeincome tax expense$6.60 BNet revenuesNet revenues$61.16 BOperating earningsOperating earnings$15.08 BNet earningsNet earnings$4.23 BImmunology - SkyriziImmunology - Skyrizi$17.56 BIncome tax expense (benefit)Income taxexpense (benefit)$2.36 BOperating expenses (calculated)Operating expenses(calculated)$27.88 BImmunology - RinvoqImmunology - Rinvoq$8.30 BOther income (expense), net (calculated)Other income,net (calculated)−$8.48 BSelling, general and administrativeSelling, general and administrative$14.01 BImmunology - HumiraImmunology - Humira$4.54 BUndisclosed (calculated)Undisclosed (calculated)$4.17 BCost of products soldCost of products sold$18.20 BResearch and developmentResearch and development$9.10 BNeuroscience - Botox TherapeuticNeuroscience - Botox Therapeutic$3.77 BAcquired IPR&D and milestonesAcquired IPR&D and milestones$5.02 BNeuroscience - VraylarNeuroscience - Vraylar$3.62 BOther operating incomeOther operating income−$241.00 MOncology - ImbruvicaOncology - Imbruvica$2.87 BOncology - VenclextaOncology - Venclexta$2.79 BAesthetics - Botox CosmeticAesthetics - Botox Cosmetic$2.60 BNeuroscience - UbrelvyNeuroscience - Ubrelvy$1.27 BAesthetics - Other AestheticsAesthetics - Other Aesthetics$1.27 BNeuroscience - QuliptaNeuroscience - Qulipta$1.04 BEye Care - Other Eye CareEye Care - Other Eye Care$1.01 BAesthetics - Juvederm CollectionAesthetics - Juvederm Collection$993.00 MOncology - ElahereOncology - Elahere$690.00 MEye Care - OzurdexEye Care - Ozurdex$493.00 MNeuroscience - VyalevNeuroscience - Vyalev$482.00 MEye Care - Lumigan/GanfortEye Care - Lumigan/Ganfort$410.00 MNeuroscience - DuodopaNeuroscience - Duodopa$381.00 MOncology - EpkinlyOncology - Epkinly$271.00 MNeuroscience - Other NeuroscienceNeuroscience - Other Neuroscience$207.00 MEye Care - Alphagan/CombiganEye Care - Alphagan/Combigan$197.00 MOther Key Products - MavyretOther Key Products - Mavyret$1.32 BOther Key Products - Linzess/ConstellaOther Key Products- Linzess/Constella$907.00 M
Chart details

AbbVie Inc. (ABBV) FY2025 Annual P&L / Income Statement

Income statement for 2025-01-01 through 2025-12-31. View: Key Product Portfolio by Product and Service. Revenue uses this breakdown; costs and expenses retain the consolidated categories.

Net revenues
61,160,000,000 US dollars
Cost of products sold
18,204,000,000 US dollars
Gross profit (calculated)
42,956,000,000 US dollars
Operating expenses (calculated)
27,881,000,000 US dollars
Operating earnings
15,075,000,000 US dollars
Other income (expense), net (calculated)
negative 8,478,000,000 US dollars
Earnings before income tax expense
6,597,000,000 US dollars
Income tax expense (benefit)
2,364,000,000 US dollars
Net earnings
4,233,000,000 US dollars
Aesthetics - Botox Cosmetic
2,602,000,000 US dollars
Aesthetics - Juvederm Collection
993,000,000 US dollars
Aesthetics - Other Aesthetics
1,265,000,000 US dollars
Eye Care - Alphagan/Combigan
197,000,000 US dollars
Eye Care - Lumigan/Ganfort
410,000,000 US dollars
Eye Care - Other Eye Care
1,009,000,000 US dollars
Eye Care - Ozurdex
493,000,000 US dollars
Immunology - Humira
4,540,000,000 US dollars
Immunology - Rinvoq
8,304,000,000 US dollars
Immunology - Skyrizi
17,562,000,000 US dollars
Neuroscience - Botox Therapeutic
3,769,000,000 US dollars
Neuroscience - Duodopa
381,000,000 US dollars
Neuroscience - Other Neuroscience
207,000,000 US dollars
Neuroscience - Qulipta
1,036,000,000 US dollars
Neuroscience - Ubrelvy
1,271,000,000 US dollars
Neuroscience - Vraylar
3,621,000,000 US dollars
Neuroscience - Vyalev
482,000,000 US dollars
Oncology - Elahere
690,000,000 US dollars
Oncology - Epkinly
271,000,000 US dollars
Oncology - Imbruvica
2,869,000,000 US dollars
Oncology - Venclexta
2,792,000,000 US dollars
Other Key Products - Linzess/Constella
907,000,000 US dollars
Other Key Products - Mavyret
1,317,000,000 US dollars
Undisclosed (calculated)
4,172,000,000 US dollars
Selling, general and administrative
14,010,000,000 US dollars
Research and development
9,096,000,000 US dollars
Acquired IPR&D and milestones
5,016,000,000 US dollars
Other operating income
negative 241,000,000 US dollars

Chart connections

  • Revenue less cost of revenue equals gross profit; gross profit less operating expenses equals operating income.
  • Operating income plus other income or expense equals income before tax. Income before tax less income tax expense or benefit equals net income.
  • Of which attributable to AbbVie Inc.: $4.23 B; to noncontrolling interests: $7.00 M.
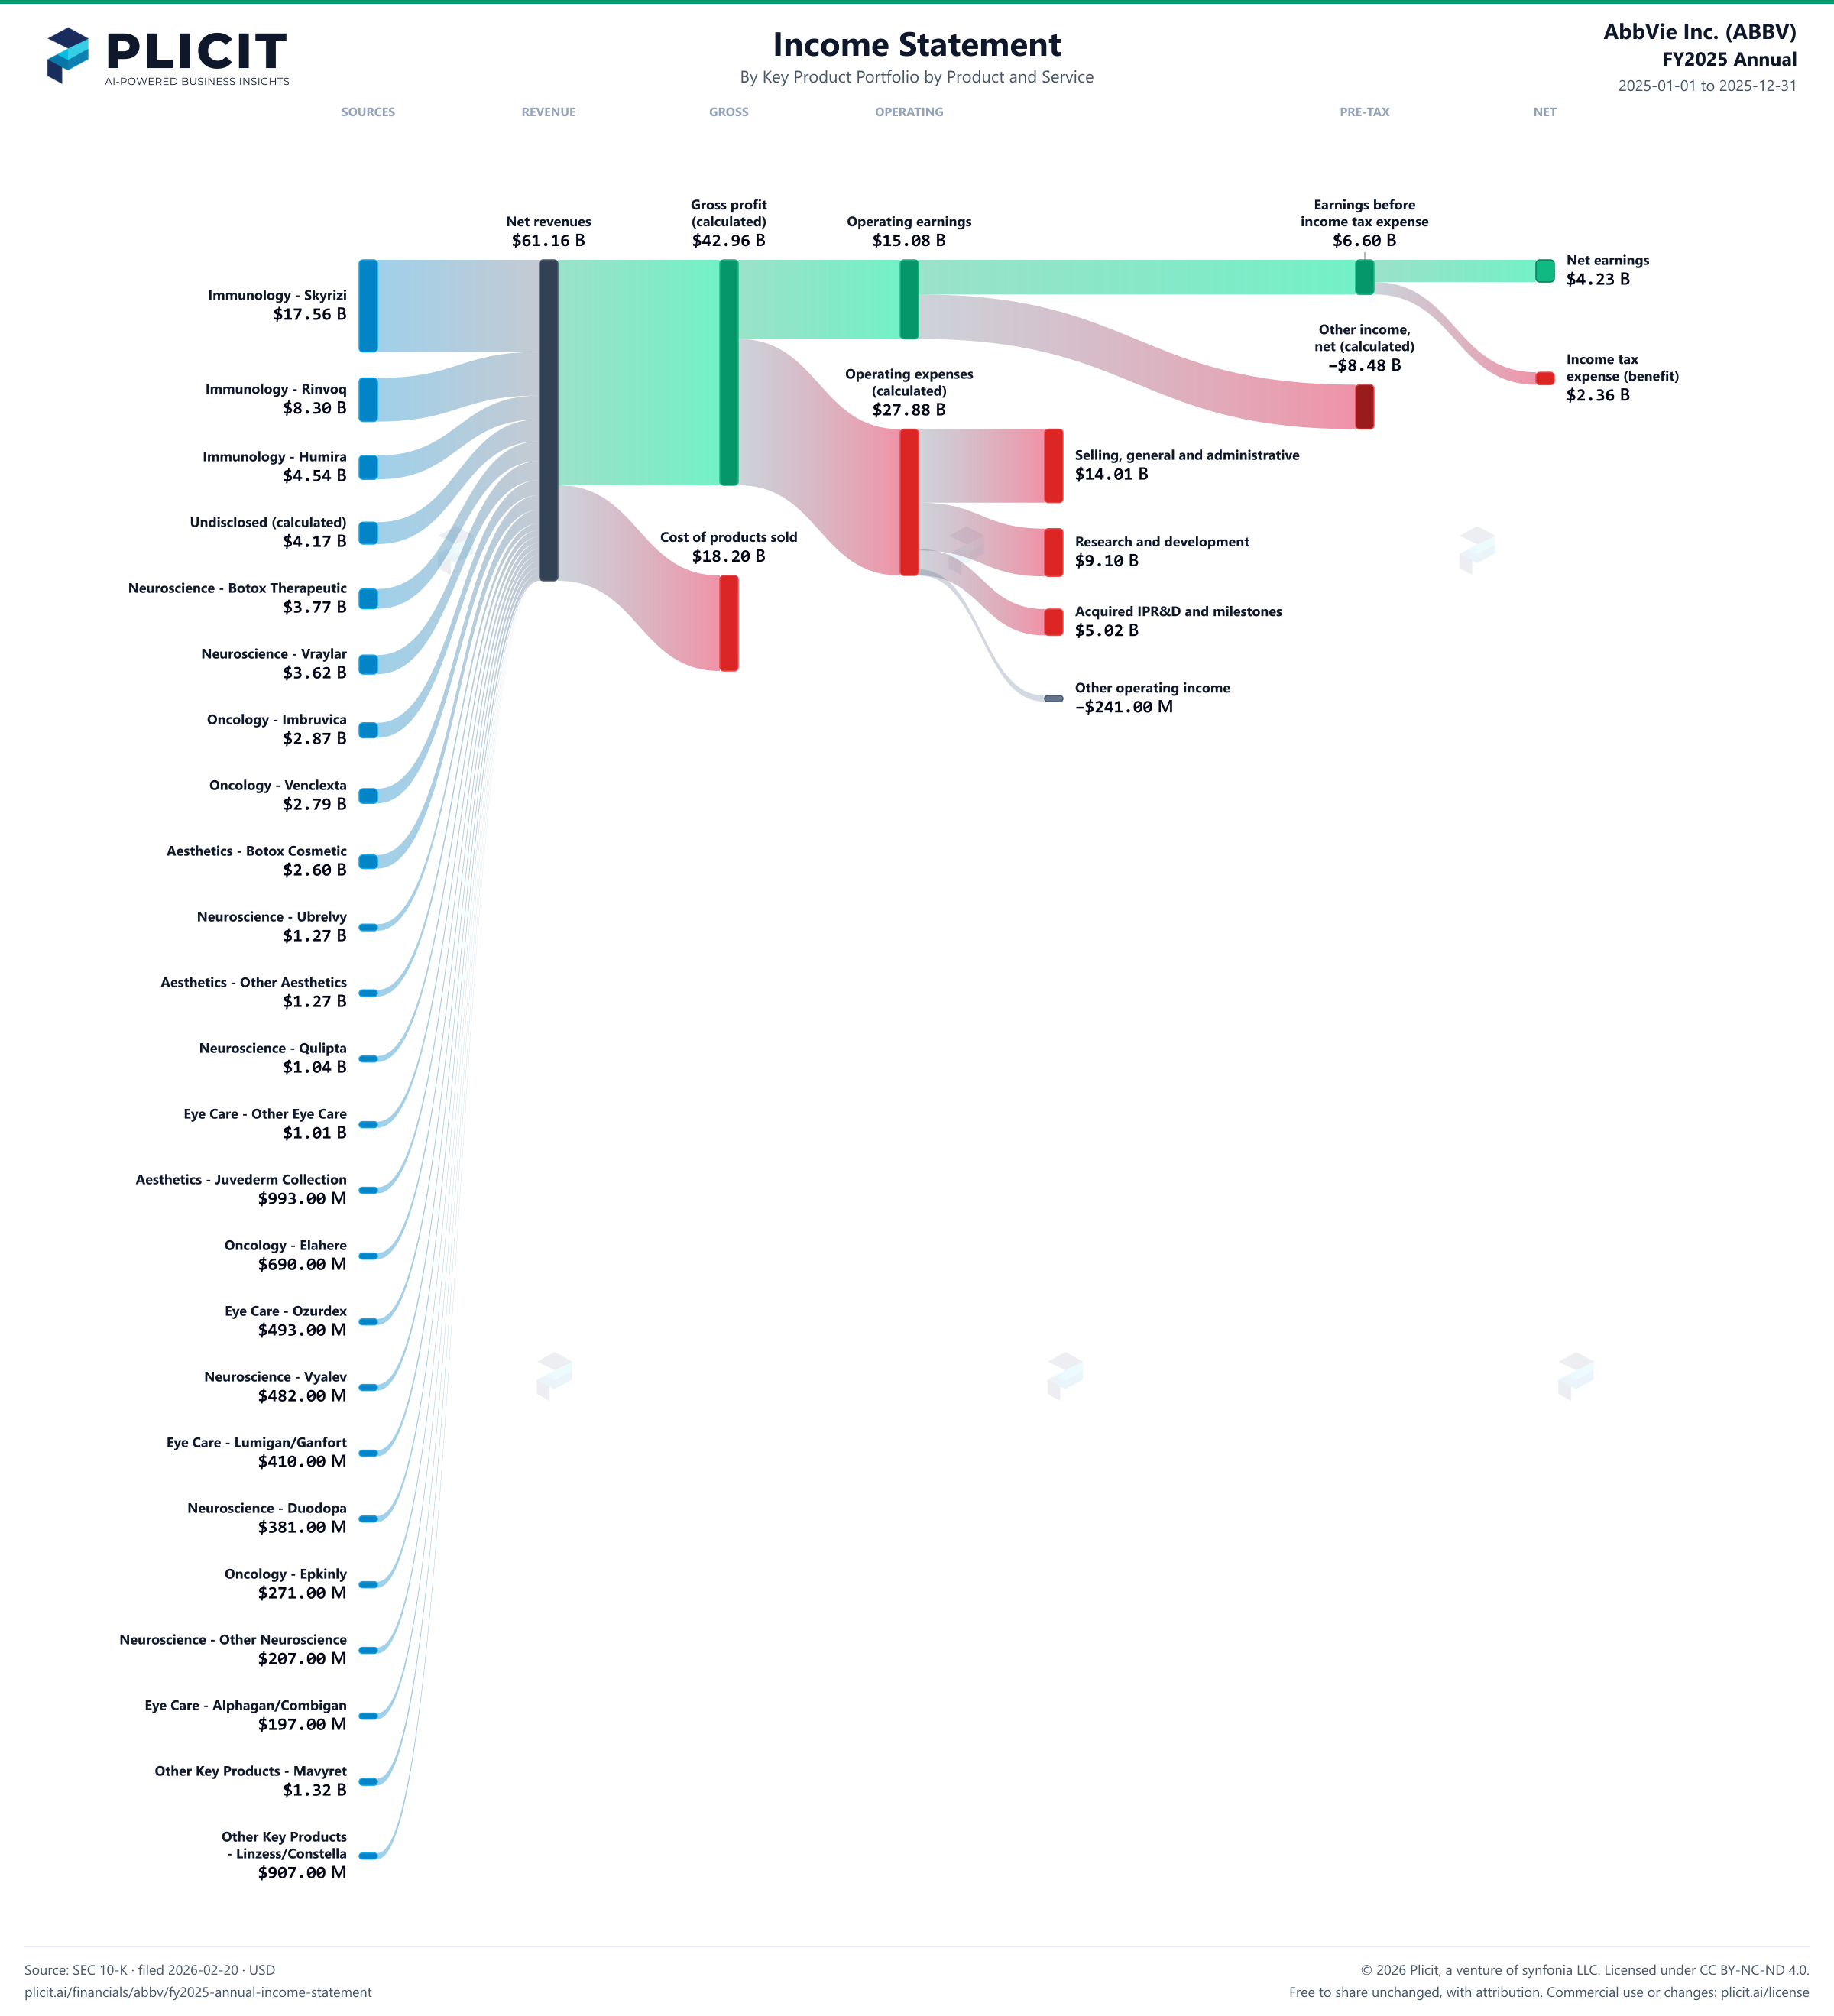
AbbVie Inc. (ABBV) FY2025 Annual P&L / Income Statement Sankey chart, Product and service — Key Product Portfolio by Product and Service view
Free to share unchanged, with credit to Plicit.ai · CC BY-NC-ND 4.0Download PNG

Gross margin

70.2%

Gross profit / revenue

Operating margin

24.6%

Operating profit / revenue

Cash conversion

449.6%

Operating cash / net income, same period

Newsletter

Get the teardowns by email

Subscribe if you want the public-company teardowns in your inbox when they're released.

Product waitlist

Health Check and Teardown for your own company

A health check uncovers insights of your private books, not a public ticker. Join this list to get notified as soon as we go-live!