
AXCELIS TECHNOLOGIES INC (ACLS) FY2023 Annual Balance Sheet
As of 2023-12-31
Balance Sheet
As of 2023-12-31
Swipe to see the full flow
Chart details
AXCELIS TECHNOLOGIES INC (ACLS) FY2023 Annual Balance Sheet
Balance sheet as of 2023-12-31. The chart shows assets, liabilities and equity at that date.
- Assets
- 1,281,967,000 US dollars
- Current assets
- 1,079,991,000 US dollars
- Non-current assets
- 201,976,000 US dollars
- Liabilities
- 417,085,000 US dollars
- Current liabilities
- 285,129,000 US dollars
- Non-current liabilities
- 131,956,000 US dollars
- Equity
- 864,882,000 US dollars
- Short-term investments
- 338,851,000 US dollars
- Inventories, net
- 306,482,000 US dollars
- Accounts receivable, net
- 217,964,000 US dollars
- Cash and cash equivalents
- 167,297,000 US dollars
- Prepaid expenses and other current assets
- 49,397,000 US dollars
- Property, plant and equipment, net
- 53,971,000 US dollars
- Deferred income taxes
- 53,428,000 US dollars
- Other assets
- 40,575,000 US dollars
- Operating lease assets
- 30,716,000 US dollars
- Finance lease assets, net
- 16,632,000 US dollars
- Long-term restricted cash
- 6,654,000 US dollars
- Deferred revenue
- 164,677,000 US dollars
- Accounts payable
- 54,400,000 US dollars
- Accrued compensation
- 31,445,000 US dollars
- Warranty
- 14,098,000 US dollars
- Other current liabilities
- 12,834,000 US dollars
- Income taxes
- 6,164,000 US dollars
- Current portion of finance lease obligation
- 1,511,000 US dollars
- Long-term deferred revenue
- 46,208,000 US dollars
- Long-term finance lease obligation
- 43,674,000 US dollars
- Other long-term liabilities
- 42,074,000 US dollars
- Additional paid-in capital
- 547,189,000 US dollars
- Retained earnings
- 319,506,000 US dollars
- Common stock, $0.001 par value, 75,000 shares authorized; 32,685 shares issued and outstanding at December 31, 2023; 32,775 shares issued and outstanding at December 31, 2022
- 33,000 US dollars
- Accumulated other comprehensive loss
- negative 1,846,000 US dollars
- Gross equity (calculated)
- 866,728,000 US dollars. Net equity plus the magnitudes of its negative contributions equals gross positive equity. The negative contributions enter this reconciliation as add-backs; their filed signs stay negative.
Chart connections
- Assets equal liabilities plus consolidated equity. Consolidated equity includes noncontrolling interests when reported.
- Treasury shares and other negative equity contributions reduce equity.
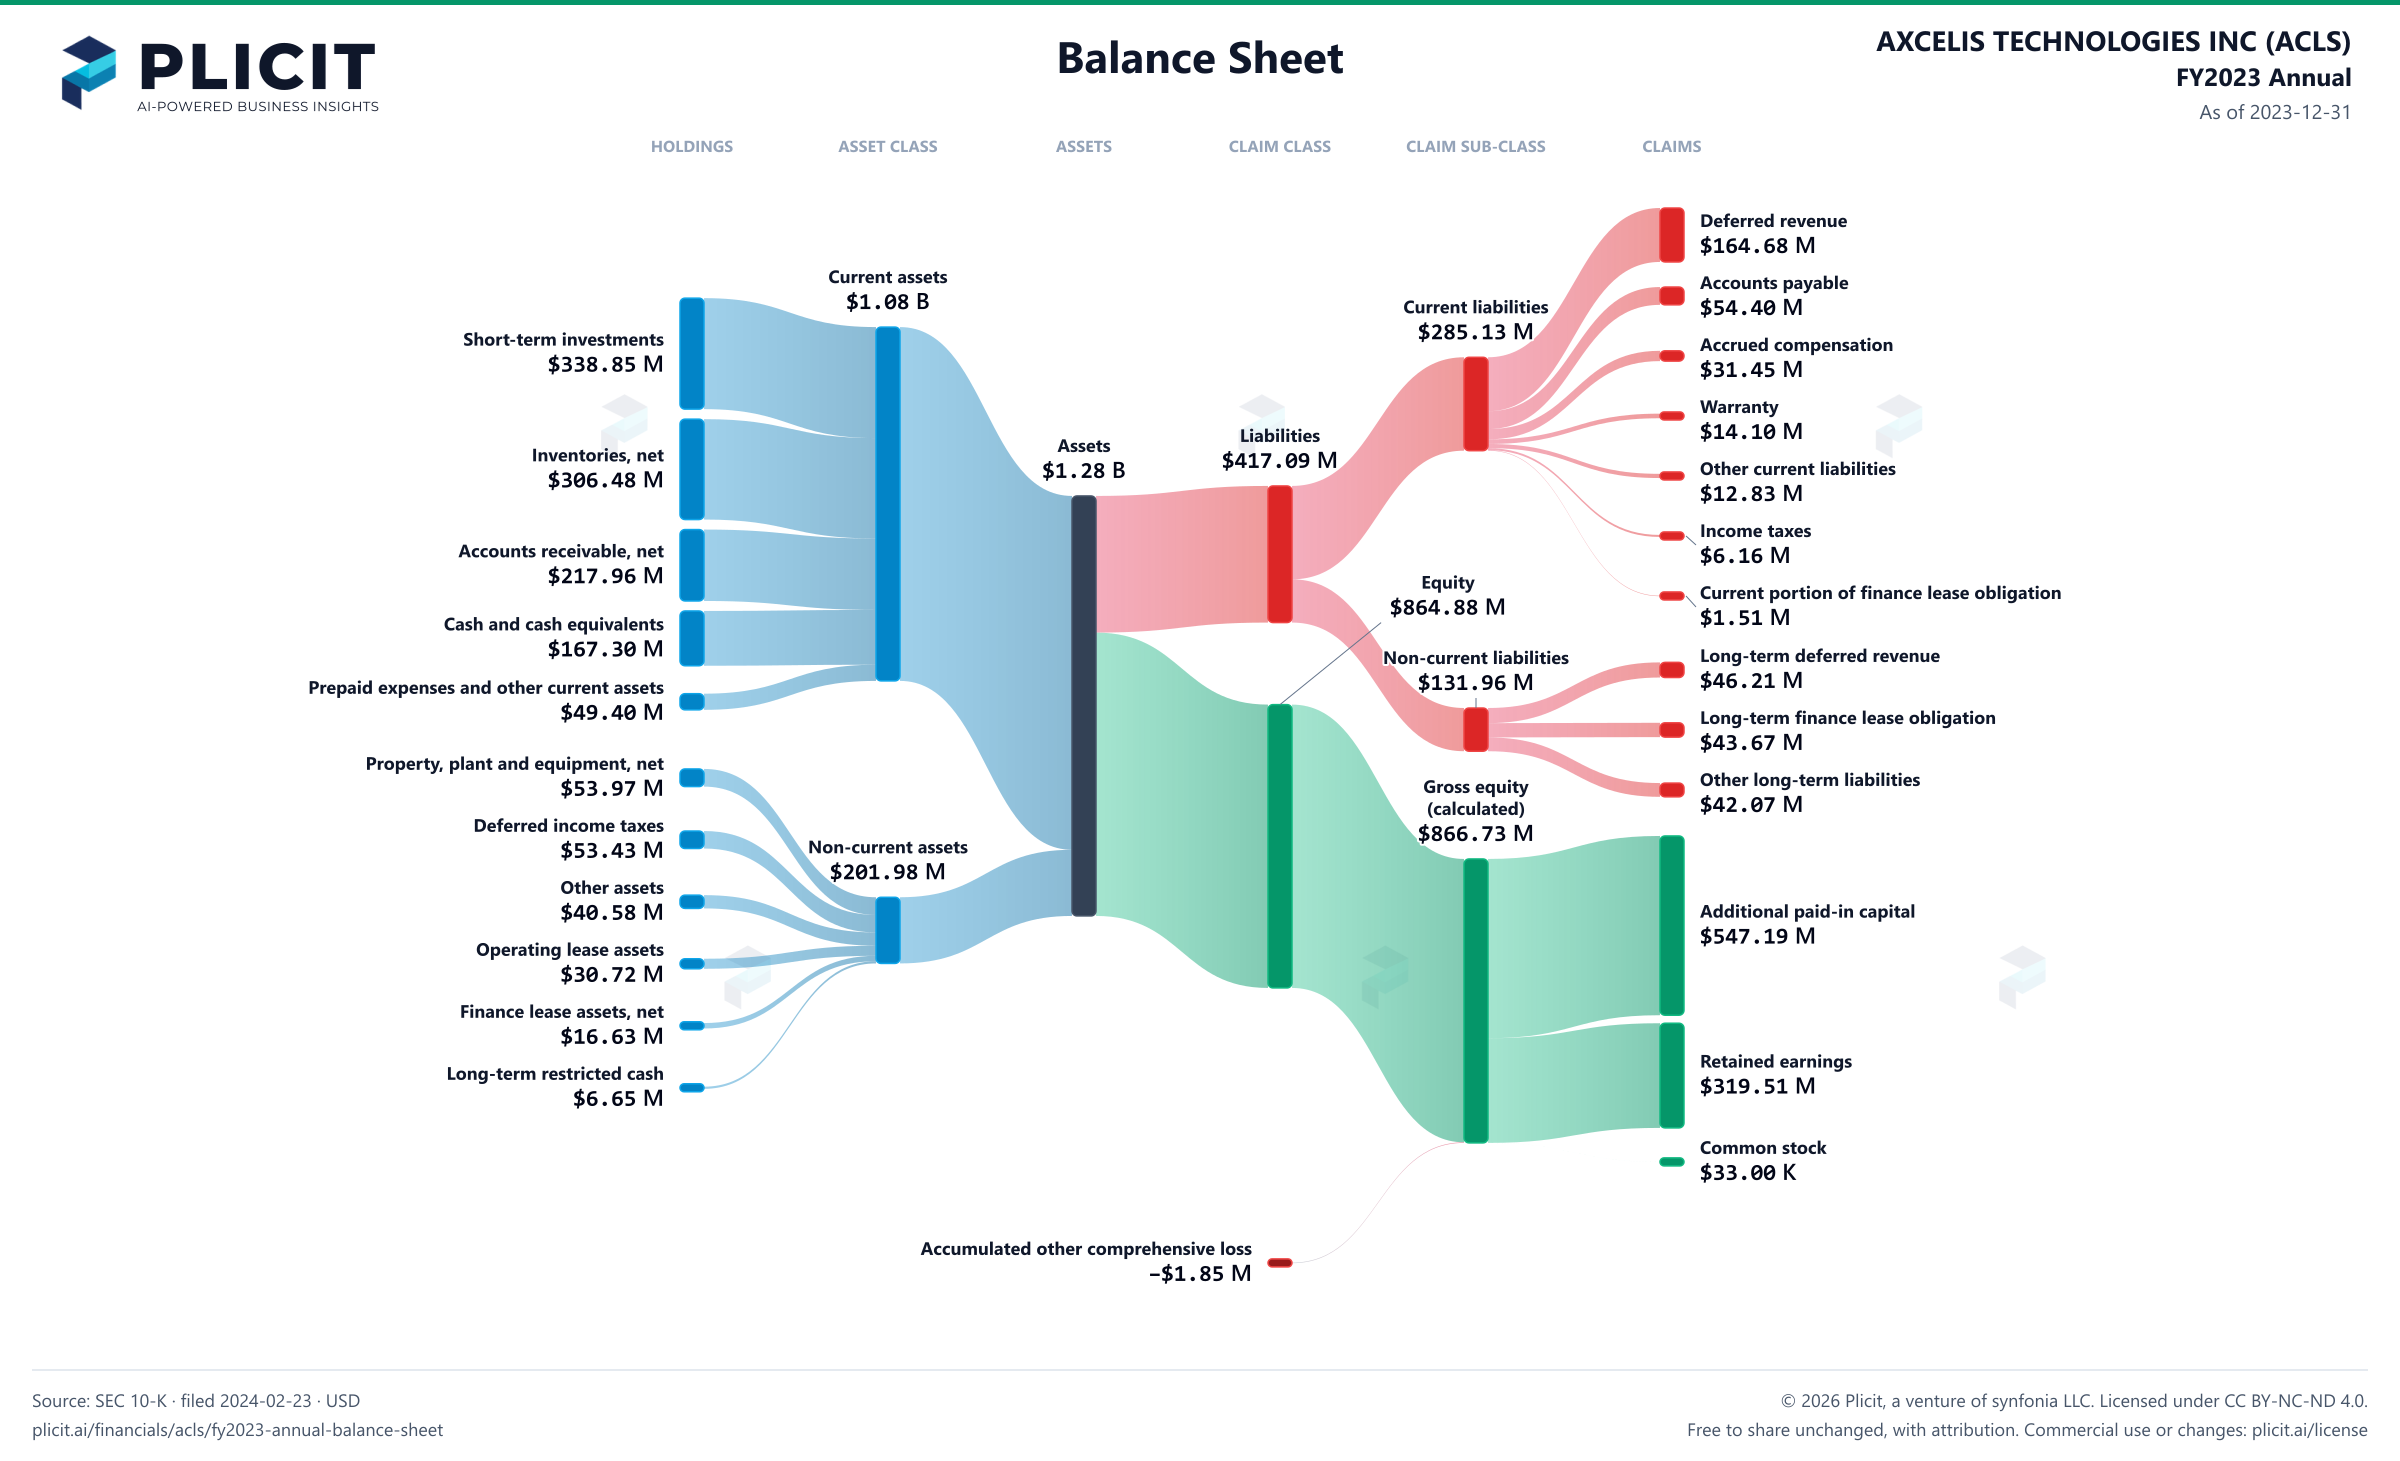
Free to share unchanged, with credit to Plicit.ai · CC BY-NC-ND 4.0Download PNG
Product waitlist
Health Check and Teardown for your own company
A health check uncovers insights of your private books, not a public ticker. Join this list to get notified as soon as we go-live!