
AGCO CORP /DE (AGCO) FY2026 Q2 P&L / Income Statement

Revenue by Business Segment by Product and Service

2026-04-01 to 2026-06-30

Swipe to see the full flow
AGCO CORP /DE (AGCO) FY2026 Q2 P&L / Income StatementIncome statement for 2026-04-01 through 2026-06-30. View: Segments by Product and Service. Revenue uses this breakdown; costs and expenses retain the consolidated categories.SOURCESREVENUEGROSSOPERATINGPRE-TAXNETEurope/Middle East - TractorsEurope/Middle East - Replacement partsNorth America - TractorsLatin America - TractorsEurope/Middle East - Combines, application equipment and other machineryNorth America - Combines, application equipment and other machineryNorth America - Replacement partsAsia/Pacific/Africa - TractorsLatin America - Combines, application equipment and other machineryLatin America - Replacement partsAsia/Pacific/Africa - Combines, application equipment and other machineryAsia/Pacific/Africa - Replacement partsAsia/Pacific/Africa - Grain storage and protein production systemsNet salesGross profitCost of goods soldIncome from operationsOperating costs, net of other operating income (calculated)Selling, general and administrative expensesEngineering expensesAmortization of intangiblesRestructuring and business optimization expensesIncome before income taxes and equity in net earnings of affiliatesOther income (expense), net (calculated)Net incomeIncome tax provision (benefit)Equity in net earnings of affiliatesEquity in net earnings of affiliatesEquity in netearnings of affiliates$7.00 MIncome before income taxes and equity in net earnings of affiliatesIncome before incometaxes and equity in netearnings of affiliates$108.20 MNet salesNet sales$2.61 BGross profitGross profit$645.90 MIncome from operationsIncome from operations$140.70 MNet incomeNet income$74.80 MOperating costs, net of other operating income (calculated)Operating costs,net (calculated)$505.20 MEurope/Middle East - TractorsEurope/Middle East - Tractors$1.21 BIncome tax provision (benefit)Income taxprovision (benefit)$40.40 MSelling, general and administrative expensesSelling, general andadministrative expenses$335.70 MOther income (expense), net (calculated)Other income,net (calculated)−$32.50 MCost of goods soldCost of goods sold$1.96 BEurope/Middle East - Replacement partsEurope/Middle East- Replacement parts$338.30 MEngineering expensesEngineering expenses$141.20 MAmortization of intangiblesAmortization of intangibles$17.10 MNorth America - TractorsNorth America - Tractors$191.00 MRestructuring and business optimization expensesRestructuring and businessoptimization expenses$11.20 MLatin America - TractorsLatin America - Tractors$187.20 MEurope/Middle East - Combines, application equipment and other machineryEurope/Middle East -Combines, applicationequipment and other machinery$182.90 MNorth America - Combines, application equipment and other machineryNorth America - Combines, applicationequipment and other machinery$167.90 MNorth America - Replacement partsNorth America - Replacement parts$112.60 MAsia/Pacific/Africa - TractorsAsia/Pacific/Africa - Tractors$79.50 MLatin America - Combines, application equipment and other machineryLatin America - Combines, applicationequipment and other machinery$45.40 MLatin America - Replacement partsLatin America - Replacement parts$38.70 MAsia/Pacific/Africa - Combines, application equipment and other machineryAsia/Pacific/Africa -Combines, applicationequipment and other machinery$28.30 MAsia/Pacific/Africa - Replacement partsAsia/Pacific/Africa- Replacement parts$26.60 MAsia/Pacific/Africa - Grain storage and protein production systemsAsia/Pacific/Africa - Grain storageand protein production systems$100.00 K
Chart details

AGCO CORP /DE (AGCO) FY2026 Q2 P&L / Income Statement

Income statement for 2026-04-01 through 2026-06-30. View: Segments by Product and Service. Revenue uses this breakdown; costs and expenses retain the consolidated categories.

Net sales
2,609,700,000 US dollars
Cost of goods sold
1,963,800,000 US dollars
Gross profit
645,900,000 US dollars
Operating costs, net of other operating income (calculated)
505,200,000 US dollars
Income from operations
140,700,000 US dollars
Other income (expense), net (calculated)
negative 32,500,000 US dollars
Income before income taxes and equity in net earnings of affiliates
108,200,000 US dollars
Income tax provision (benefit)
40,400,000 US dollars
Net income
74,800,000 US dollars
Asia/Pacific/Africa - Combines, application equipment and other machinery
28,300,000 US dollars
Asia/Pacific/Africa - Grain storage and protein production systems
100,000 US dollars
Asia/Pacific/Africa - Replacement parts
26,600,000 US dollars
Asia/Pacific/Africa - Tractors
79,500,000 US dollars
Europe/Middle East - Combines, application equipment and other machinery
182,900,000 US dollars
Europe/Middle East - Grain storage and protein production systems
0 US dollars
Europe/Middle East - Replacement parts
338,300,000 US dollars
Europe/Middle East - Tractors
1,211,200,000 US dollars
Latin America - Combines, application equipment and other machinery
45,400,000 US dollars
Latin America - Grain storage and protein production systems
0 US dollars
Latin America - Replacement parts
38,700,000 US dollars
Latin America - Tractors
187,200,000 US dollars
North America - Combines, application equipment and other machinery
167,900,000 US dollars
North America - Grain storage and protein production systems
0 US dollars
North America - Replacement parts
112,600,000 US dollars
North America - Tractors
191,000,000 US dollars
Selling, general and administrative expenses
335,700,000 US dollars
Engineering expenses
141,200,000 US dollars
Amortization of intangibles
17,100,000 US dollars
Impairment charges
0 US dollars
Restructuring and business optimization expenses
11,200,000 US dollars
Loss on sale of business
0 US dollars
Equity in net earnings of affiliates
7,000,000 US dollars. Reported below-tax contribution to net income.

Chart connections

  • Revenue less cost of revenue equals gross profit; gross profit less operating expenses equals operating income.
  • Operating income plus other income or expense equals income before tax. Income before tax less income tax expense or benefit, plus the explicitly reported below-tax contributions, equals net income.
  • Of which attributable to AGCO CORP /DE: $77.20 M; to noncontrolling interests: −$2.40 M.
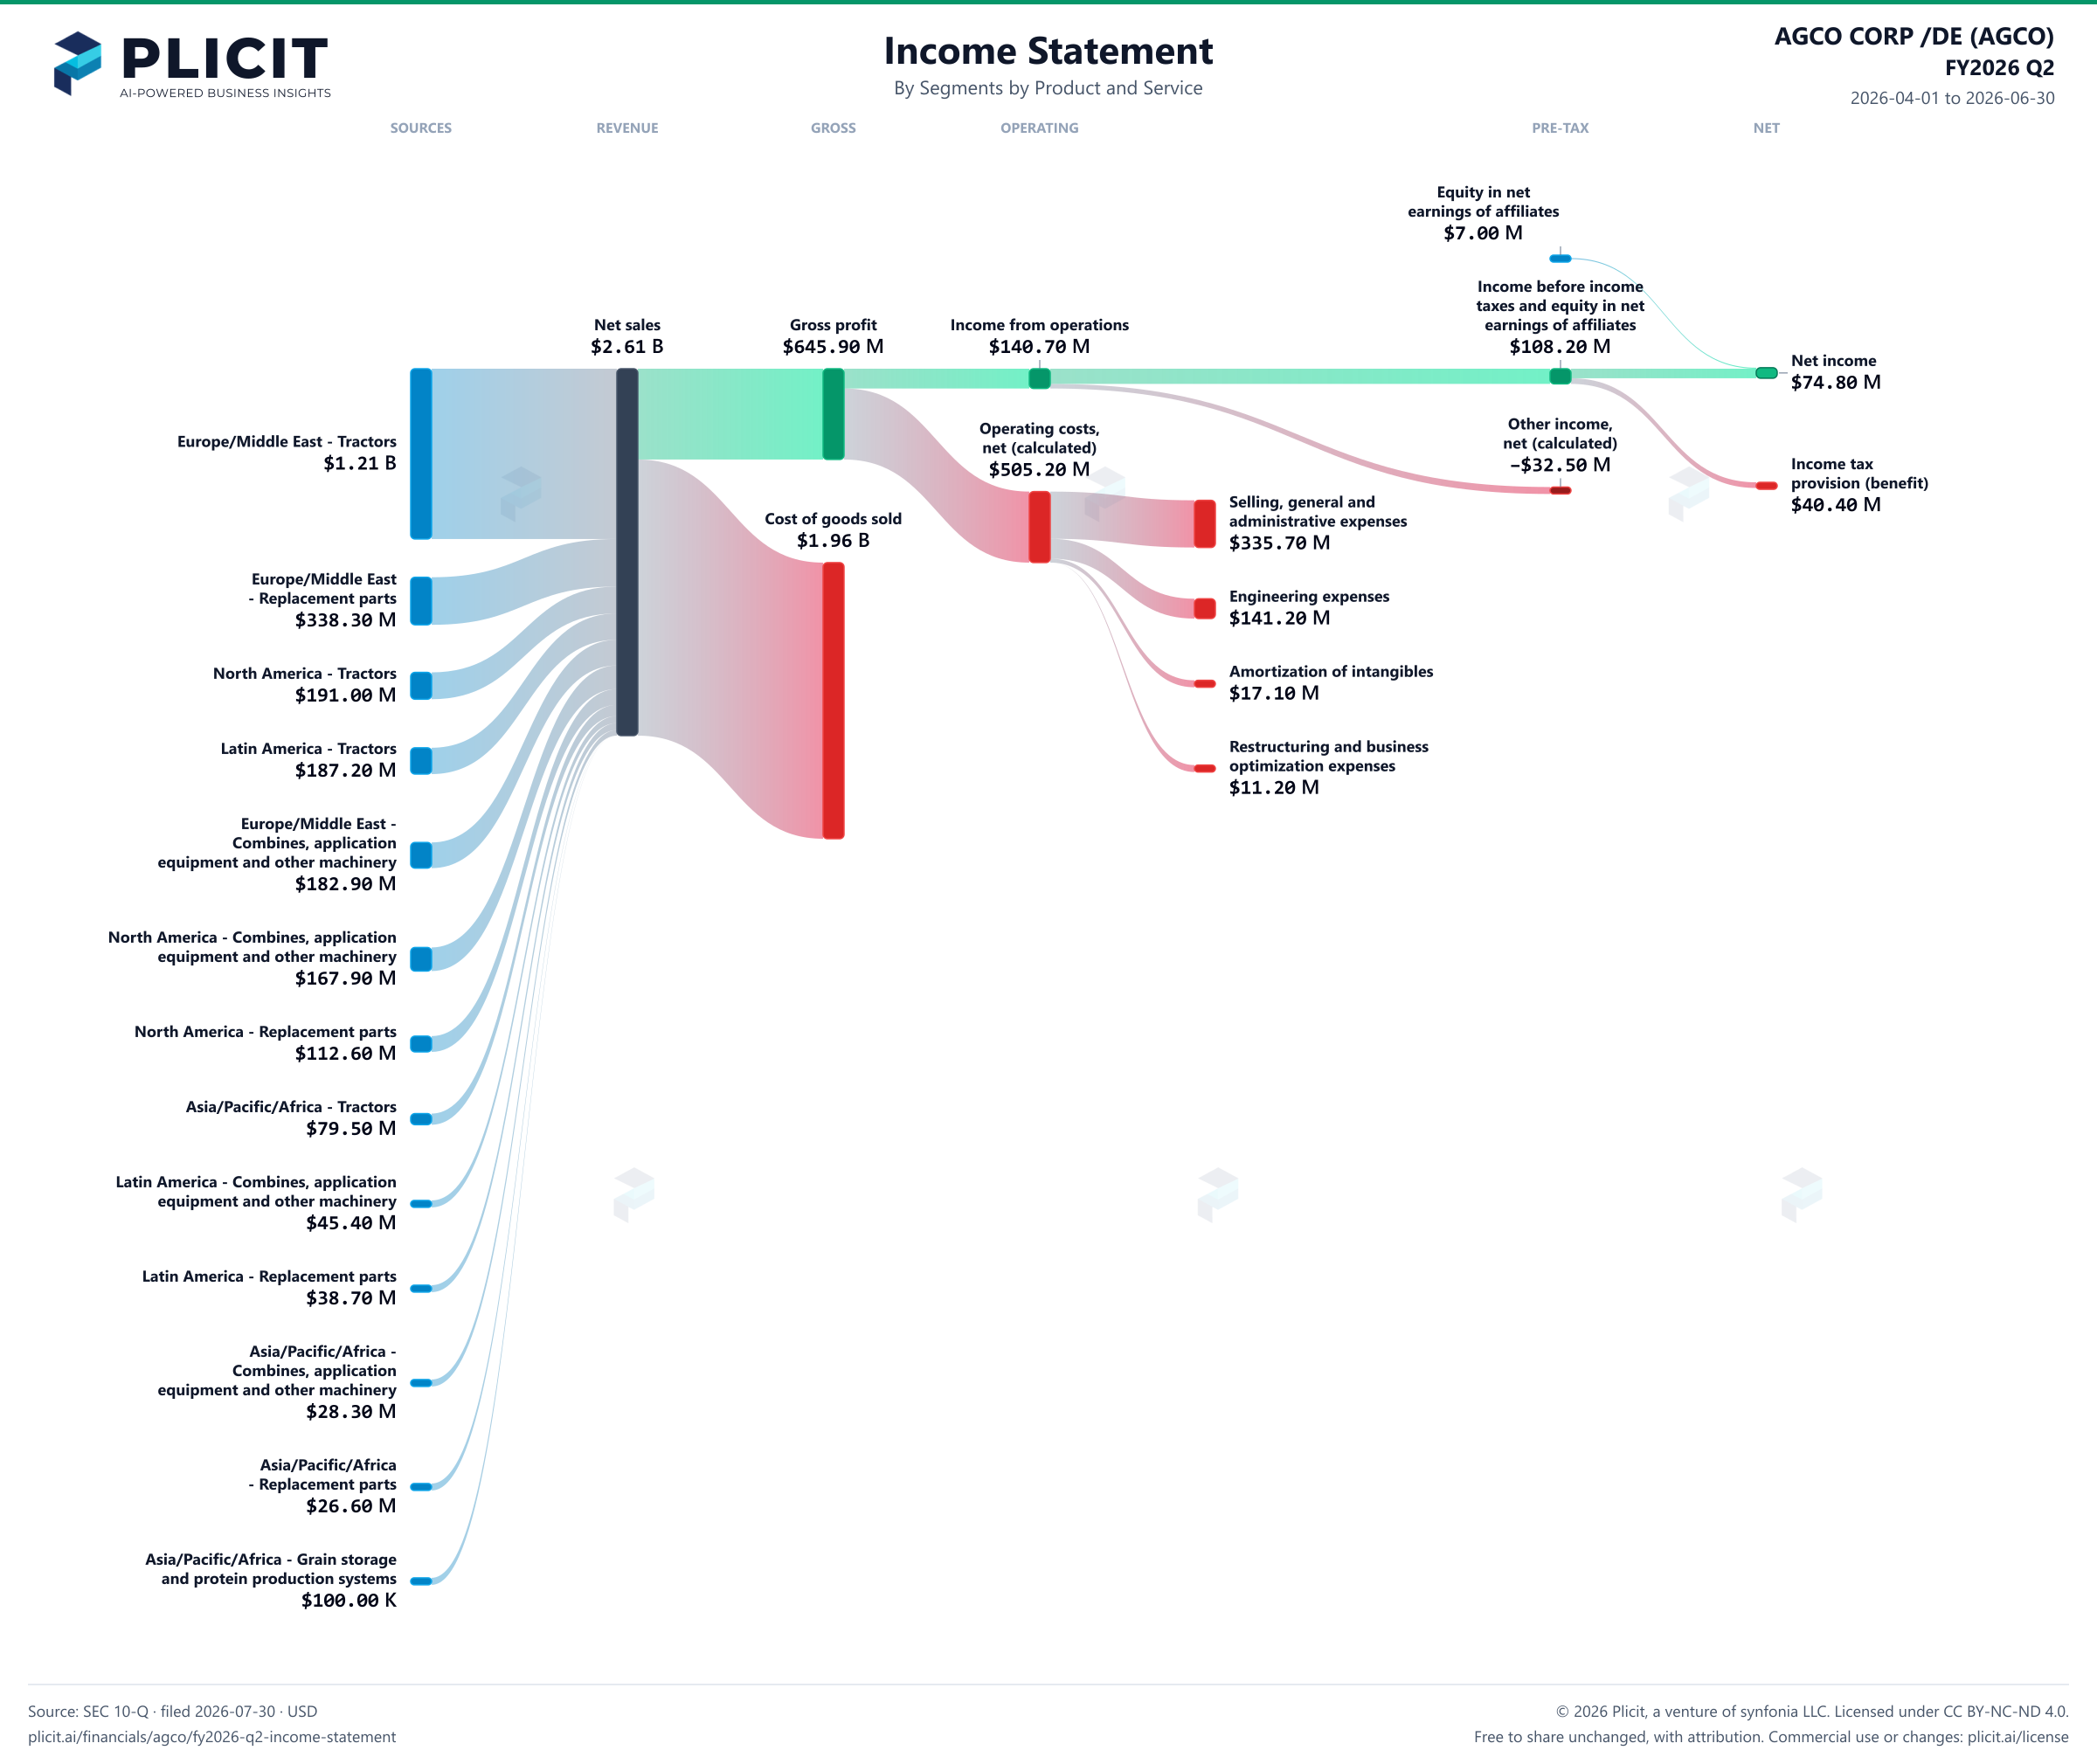
AGCO CORP /DE (AGCO) FY2026 Q2 Revenue by Business Segment by Product and Service Sankey chart
Free to share unchanged, with credit to Plicit.ai · CC BY-NC-ND 4.0Download PNG

Gross margin

24.7%

Gross profit / revenue

Operating margin

5.4%

Operating profit / revenue

Cash conversion

221.1%

Operating cash / net income, same period

Newsletter

Get the teardowns by email

Subscribe if you want the public-company teardowns in your inbox when they're released.

Product waitlist

Health Check and Teardown for your own company

A health check uncovers insights of your private books, not a public ticker. Join this list to get notified as soon as we go-live!