
APPLIED INDUSTRIAL TECHNOLOGIES, INC. (AIT) FY2026 Annual Balance Sheet
As of 2026-06-30
Balance Sheet
As of 2026-06-30
Swipe to see the full flow
Chart details
APPLIED INDUSTRIAL TECHNOLOGIES, INC. (AIT) FY2026 Annual Balance Sheet
Balance sheet as of 2026-06-30. The chart shows assets, liabilities and equity at that date.
- Assets
- 3,009,973,000 US dollars
- Current assets
- 1,578,729,000 US dollars
- Non-current assets
- 1,431,244,000 US dollars
- Liabilities
- 1,148,224,000 US dollars
- Current liabilities
- 612,411,000 US dollars
- Non-current liabilities
- 535,813,000 US dollars
- Equity
- 1,861,749,000 US dollars
- Land
- 13,900,000 US dollars. Part of Property — net, drawn as one net amount.
- Buildings
- 116,881,000 US dollars. Part of Property — net, drawn as one net amount.
- Equipment
- 266,280,000 US dollars. Part of Property — net, drawn as one net amount.
- Less accumulated depreciation
- negative 265,410,000 US dollars. Part of Property — net, drawn as one net amount.
- Accounts receivable — net
- 831,244,000 US dollars
- Inventories
- 508,979,000 US dollars
- Cash and cash equivalents
- 127,130,000 US dollars
- Other current assets
- 111,376,000 US dollars
- Goodwill
- 704,700,000 US dollars
- Identifiable intangibles — net
- 312,814,000 US dollars
- Operating lease assets — net
- 213,199,000 US dollars
- Property — net
- 131,651,000 US dollars
- Other assets
- 68,880,000 US dollars
- Accounts payable
- 341,094,000 US dollars
- Other current liabilities
- 162,257,000 US dollars
- Compensation and related benefits
- 109,060,000 US dollars
- Other liabilities
- 273,513,000 US dollars
- Long-term debt
- 262,300,000 US dollars
- Retained earnings
- 2,788,709,000 US dollars
- Additional paid-in capital
- 204,606,000 US dollars
- Common stock — no par value; 80,000 shares authorized; 54,213 shares issued; 36,803 and 37,868 shares outstanding, respectively
- 10,000,000 US dollars
- Preferred stock — no par value; 2,500 shares authorized; none issued or outstanding
- 0 US dollars
- Treasury shares — at cost (17,411 and 16,345 shares, respectively)
- negative 1,046,770,000 US dollars
- Accumulated other comprehensive loss
- negative 94,796,000 US dollars
- Gross equity (calculated)
- 3,003,315,000 US dollars. Net equity plus the magnitudes of its negative contributions equals gross positive equity. The negative contributions enter this reconciliation as add-backs; their filed signs stay negative.
Chart connections
- Assets equal liabilities plus consolidated equity. Consolidated equity includes noncontrolling interests when reported.
- Treasury shares and other negative equity contributions reduce equity.
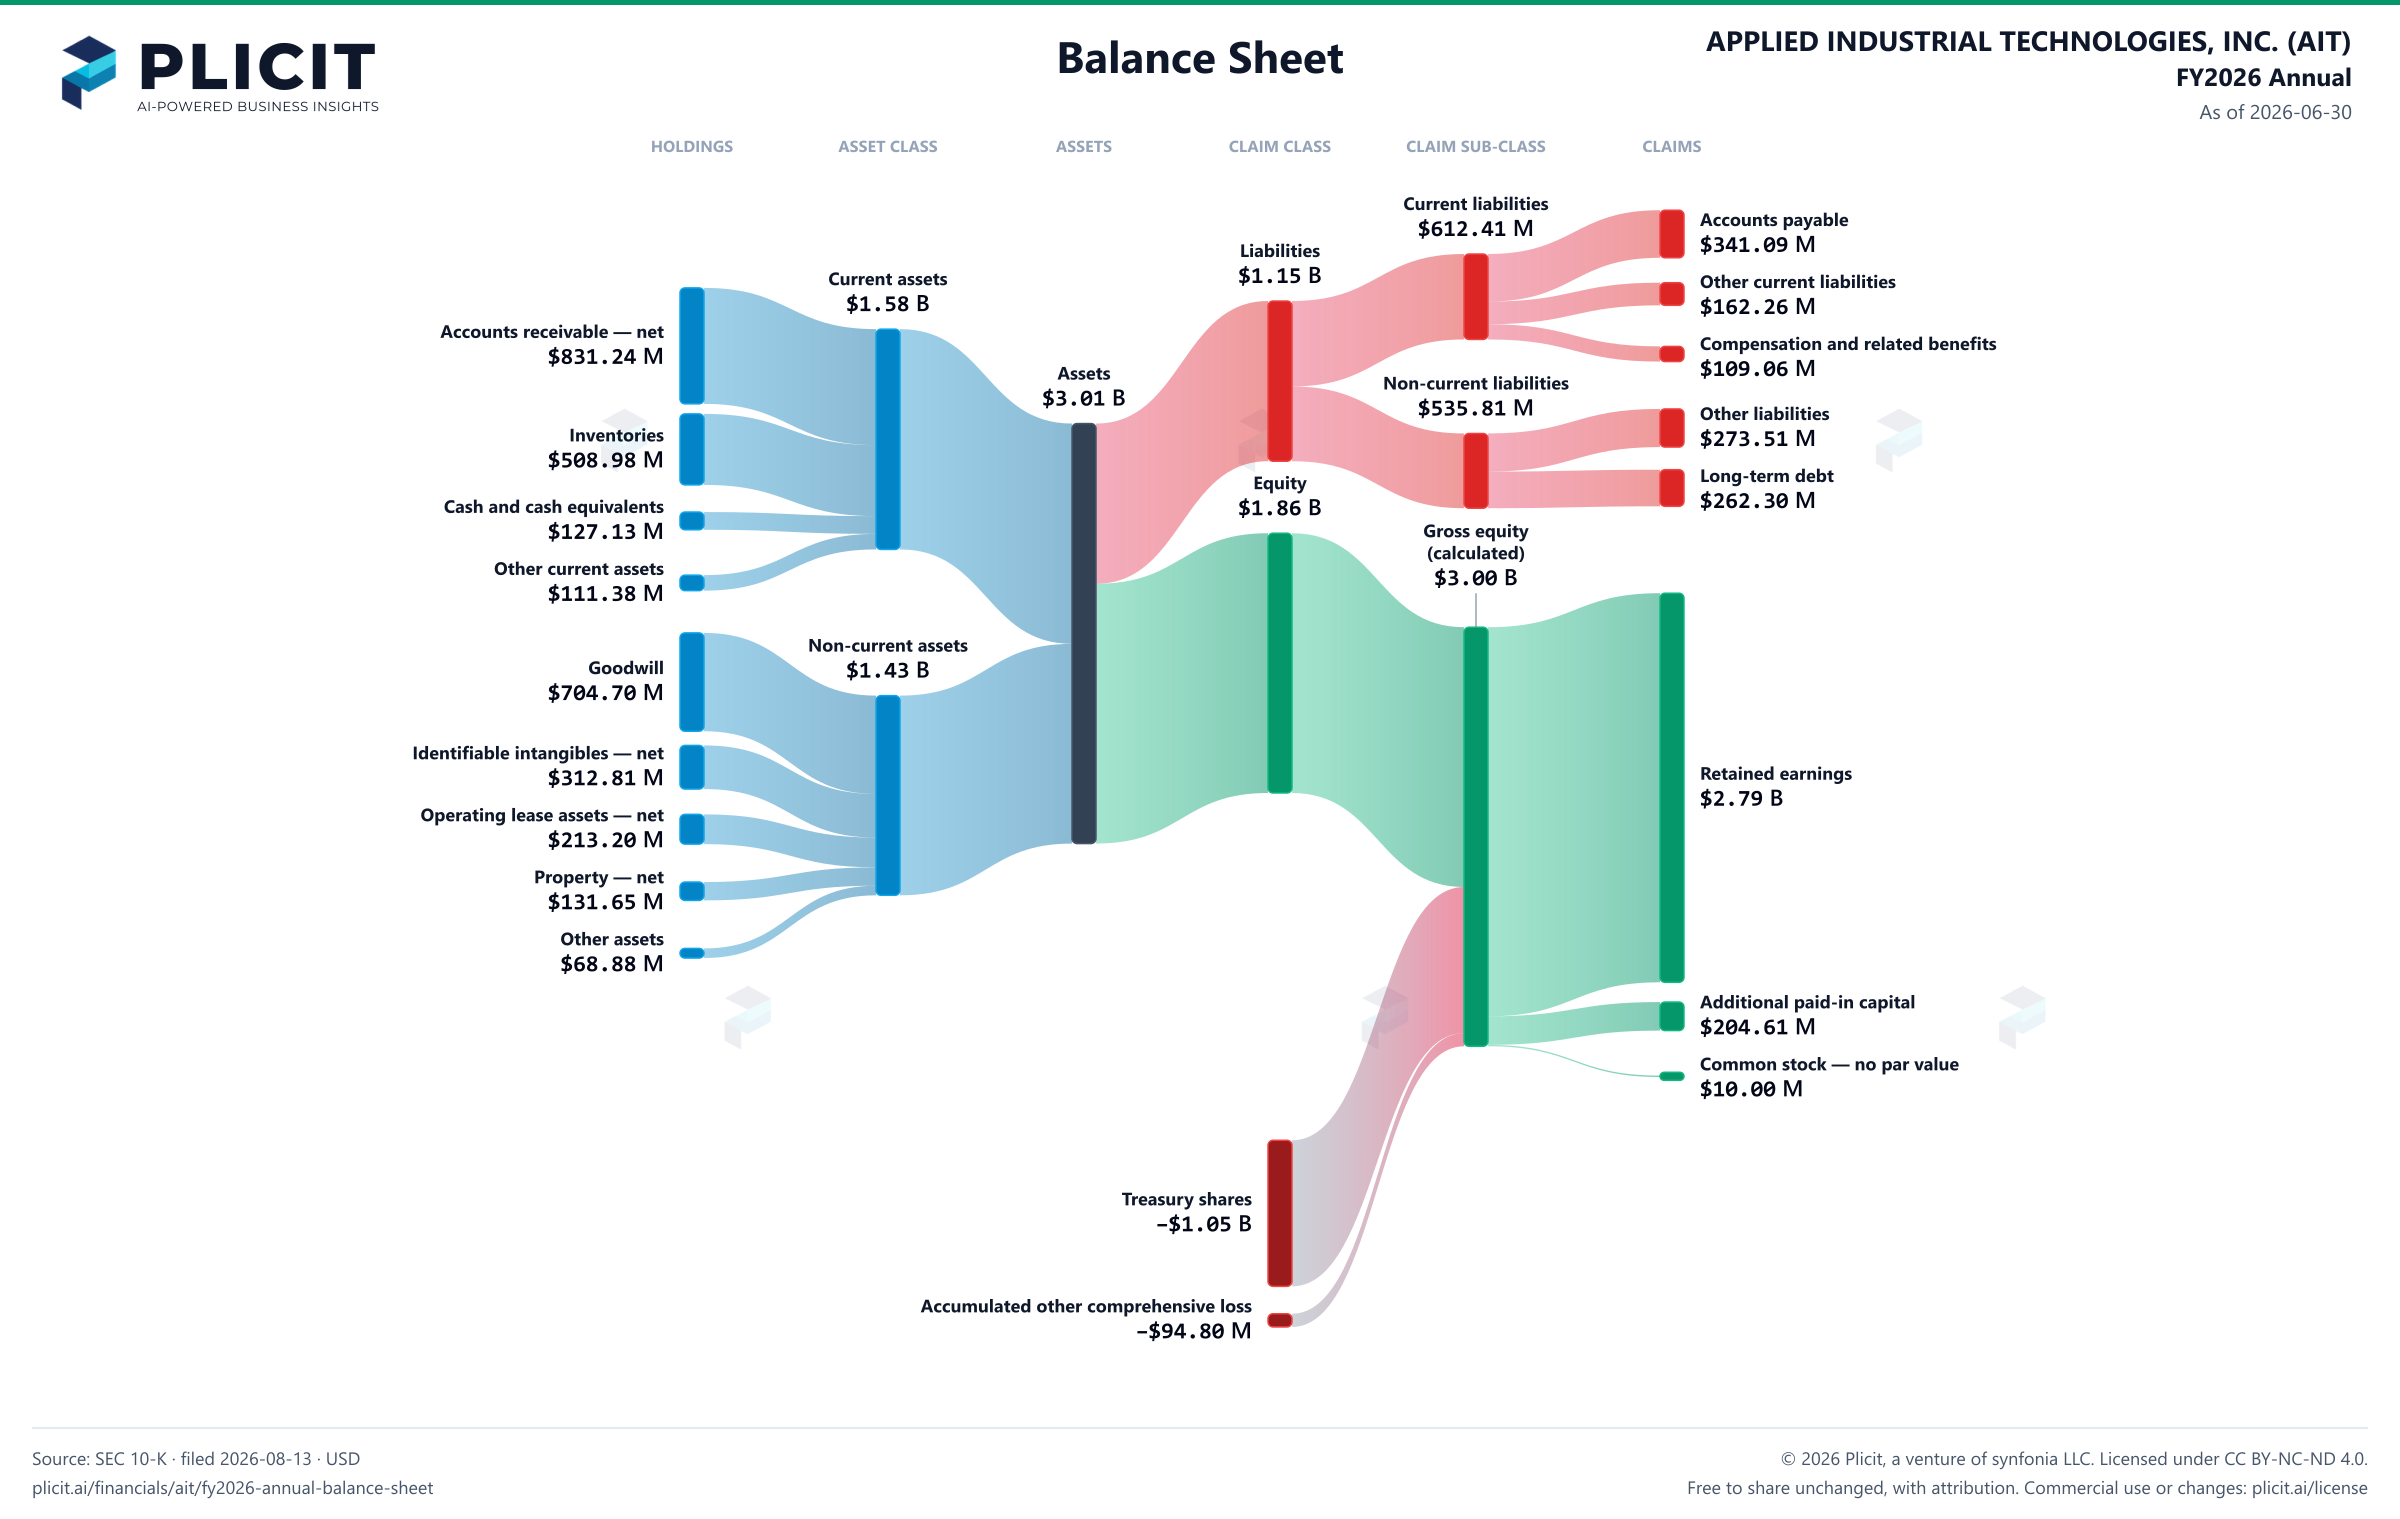
Free to share unchanged, with credit to Plicit.ai · CC BY-NC-ND 4.0Download PNG
Product waitlist
Health Check and Teardown for your own company
A health check uncovers insights of your private books, not a public ticker. Join this list to get notified as soon as we go-live!