
ALBEMARLE CORPORATION (ALB) FY2026 Q2 Balance Sheet
As of 2026-06-30
Balance Sheet
As of 2026-06-30
Swipe to see the full flow
Chart details
ALBEMARLE CORPORATION (ALB) FY2026 Q2 Balance Sheet
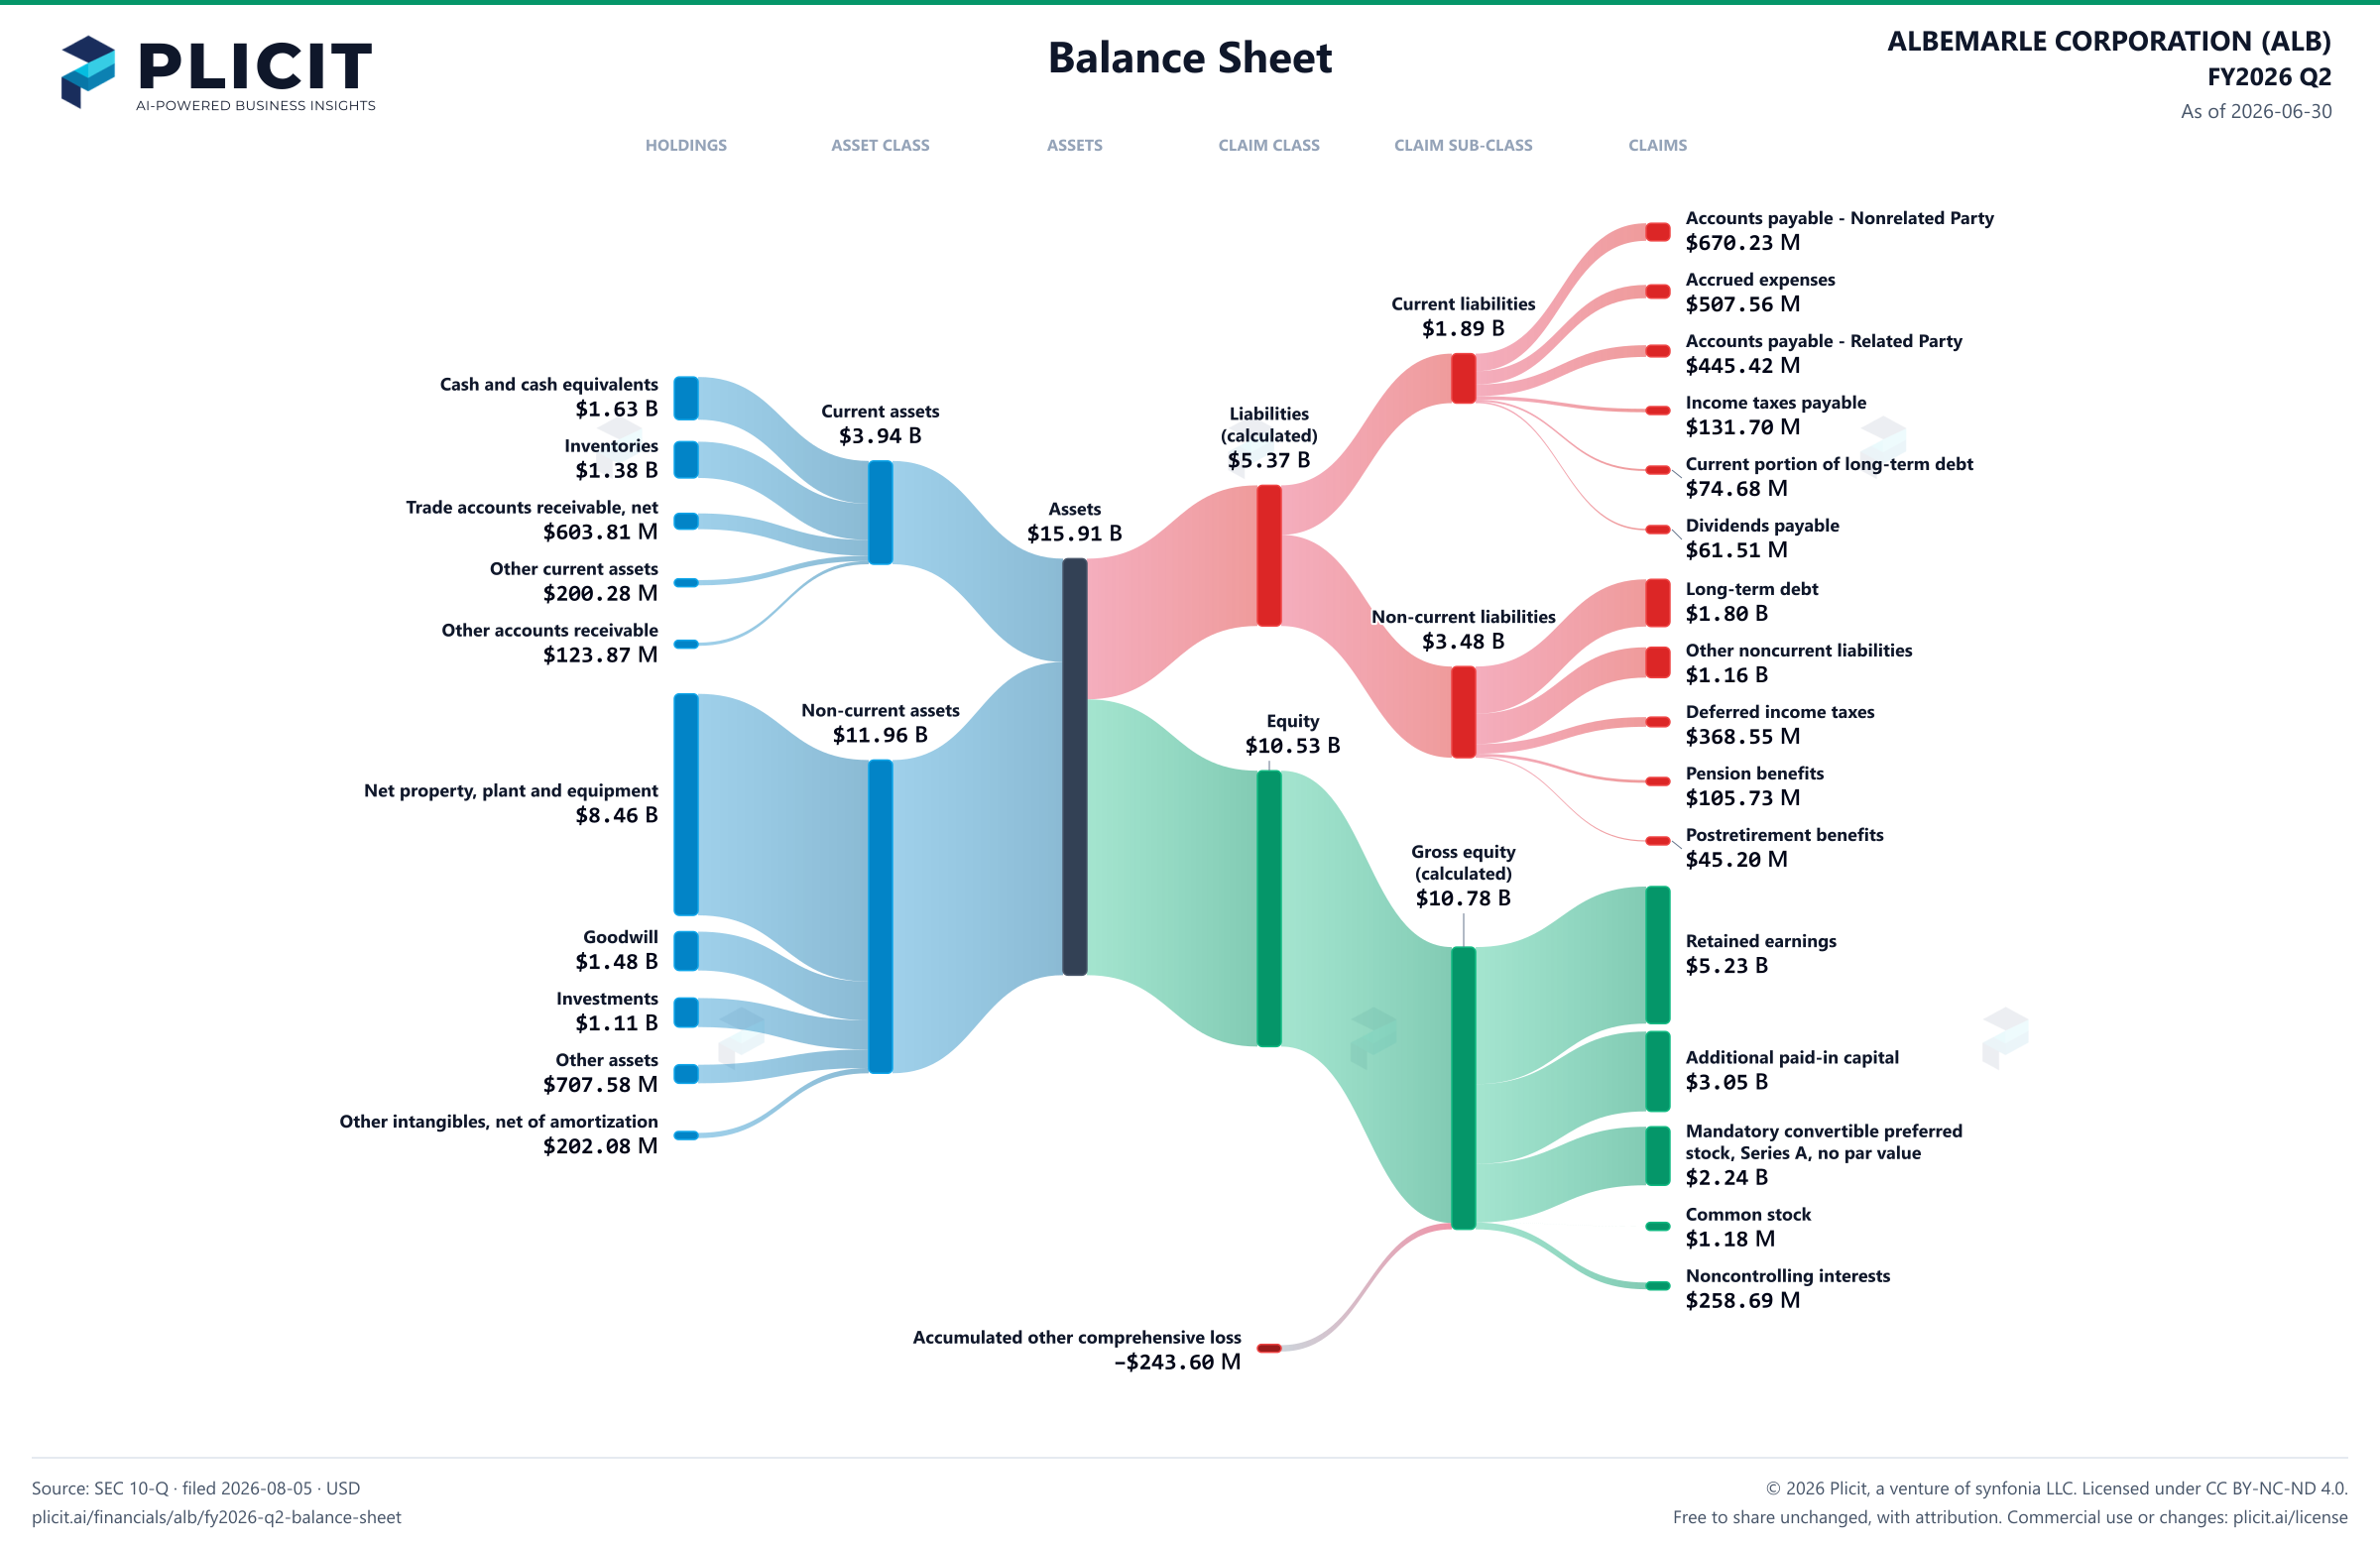
Balance sheet as of 2026-06-30. The chart shows assets, liabilities and equity at that date.
- Assets
- 15,905,095,000 US dollars
- Current assets
- 3,944,201,000 US dollars
- Non-current assets
- 11,960,894,000 US dollars
- Liabilities (calculated)
- 5,371,241,000 US dollars
- Current liabilities
- 1,891,100,000 US dollars
- Non-current liabilities
- 3,480,141,000 US dollars
- Equity
- 10,533,854,000 US dollars
- Noncontrolling interest
- 258,685,000 US dollars. Included in consolidated equity; this amount is not added again.
- Property, plant and equipment, at cost
- 11,902,156,000 US dollars. Part of Net property, plant and equipment, drawn as one net amount.
- Less accumulated depreciation and amortization
- negative 3,442,831,000 US dollars. Part of Net property, plant and equipment, drawn as one net amount.
- Cash and cash equivalents
- 1,631,688,000 US dollars
- Inventories
- 1,384,563,000 US dollars
- Trade accounts receivable, less allowance for credit losses (2026 – $4,582; 2025 – $4,578)
- 603,805,000 US dollars
- Other current assets
- 200,275,000 US dollars
- Other accounts receivable
- 123,870,000 US dollars
- Current assets held for sale
- 0 US dollars
- Net property, plant and equipment
- 8,459,325,000 US dollars
- Goodwill
- 1,482,672,000 US dollars
- Investments
- 1,109,241,000 US dollars
- Other assets
- 707,577,000 US dollars
- Other intangibles, net of amortization
- 202,079,000 US dollars
- Noncurrent assets held for sale
- 0 US dollars
- Accounts payable - Nonrelated Party
- 670,229,000 US dollars
- Accrued expenses
- 507,556,000 US dollars
- Accounts payable - Related Party
- 445,421,000 US dollars
- Income taxes payable
- 131,703,000 US dollars
- Current portion of long-term debt
- 74,677,000 US dollars
- Dividends payable
- 61,514,000 US dollars
- Current liabilities held for sale
- 0 US dollars
- Long-term debt
- 1,802,107,000 US dollars
- Other noncurrent liabilities
- 1,158,555,000 US dollars
- Deferred income taxes
- 368,552,000 US dollars
- Pension benefits
- 105,729,000 US dollars
- Postretirement benefits
- 45,198,000 US dollars
- Noncurrent liabilities held for sale
- 0 US dollars
- Retained earnings
- 5,233,819,000 US dollars
- Additional paid-in capital
- 3,048,664,000 US dollars
- Mandatory convertible preferred stock, Series A, no par value, $1,000 stated value, authorized – 15,000, issued and outstanding – 2,300 in 2026 and 2025
- 2,235,105,000 US dollars
- Common stock, $.01 par value, authorized – 275,000, issued and outstanding – 117,994 in 2026 and 117,716 in 2025
- 1,180,000 US dollars
- Noncontrolling interests
- 258,685,000 US dollars
- Accumulated other comprehensive loss
- negative 243,599,000 US dollars
- Gross equity (calculated)
- 10,777,453,000 US dollars. Net equity plus the magnitudes of its negative contributions equals gross positive equity. The negative contributions enter this reconciliation as add-backs; their filed signs stay negative.
Chart connections
- Assets equal liabilities plus consolidated equity. Consolidated equity includes noncontrolling interests when reported.
- Treasury shares and other negative equity contributions reduce equity.
Free to share unchanged, with credit to Plicit.ai · CC BY-NC-ND 4.0Download PNG
Product waitlist
Health Check and Teardown for your own company
A health check uncovers insights of your private books, not a public ticker. Join this list to get notified as soon as we go-live!