
Ally Financial Inc. (ALLY) FY2026 Q2 Balance Sheet
As of 2026-06-30
Balance Sheet
As of 2026-06-30
Swipe to see the full flow
Chart details
Ally Financial Inc. (ALLY) FY2026 Q2 Balance Sheet
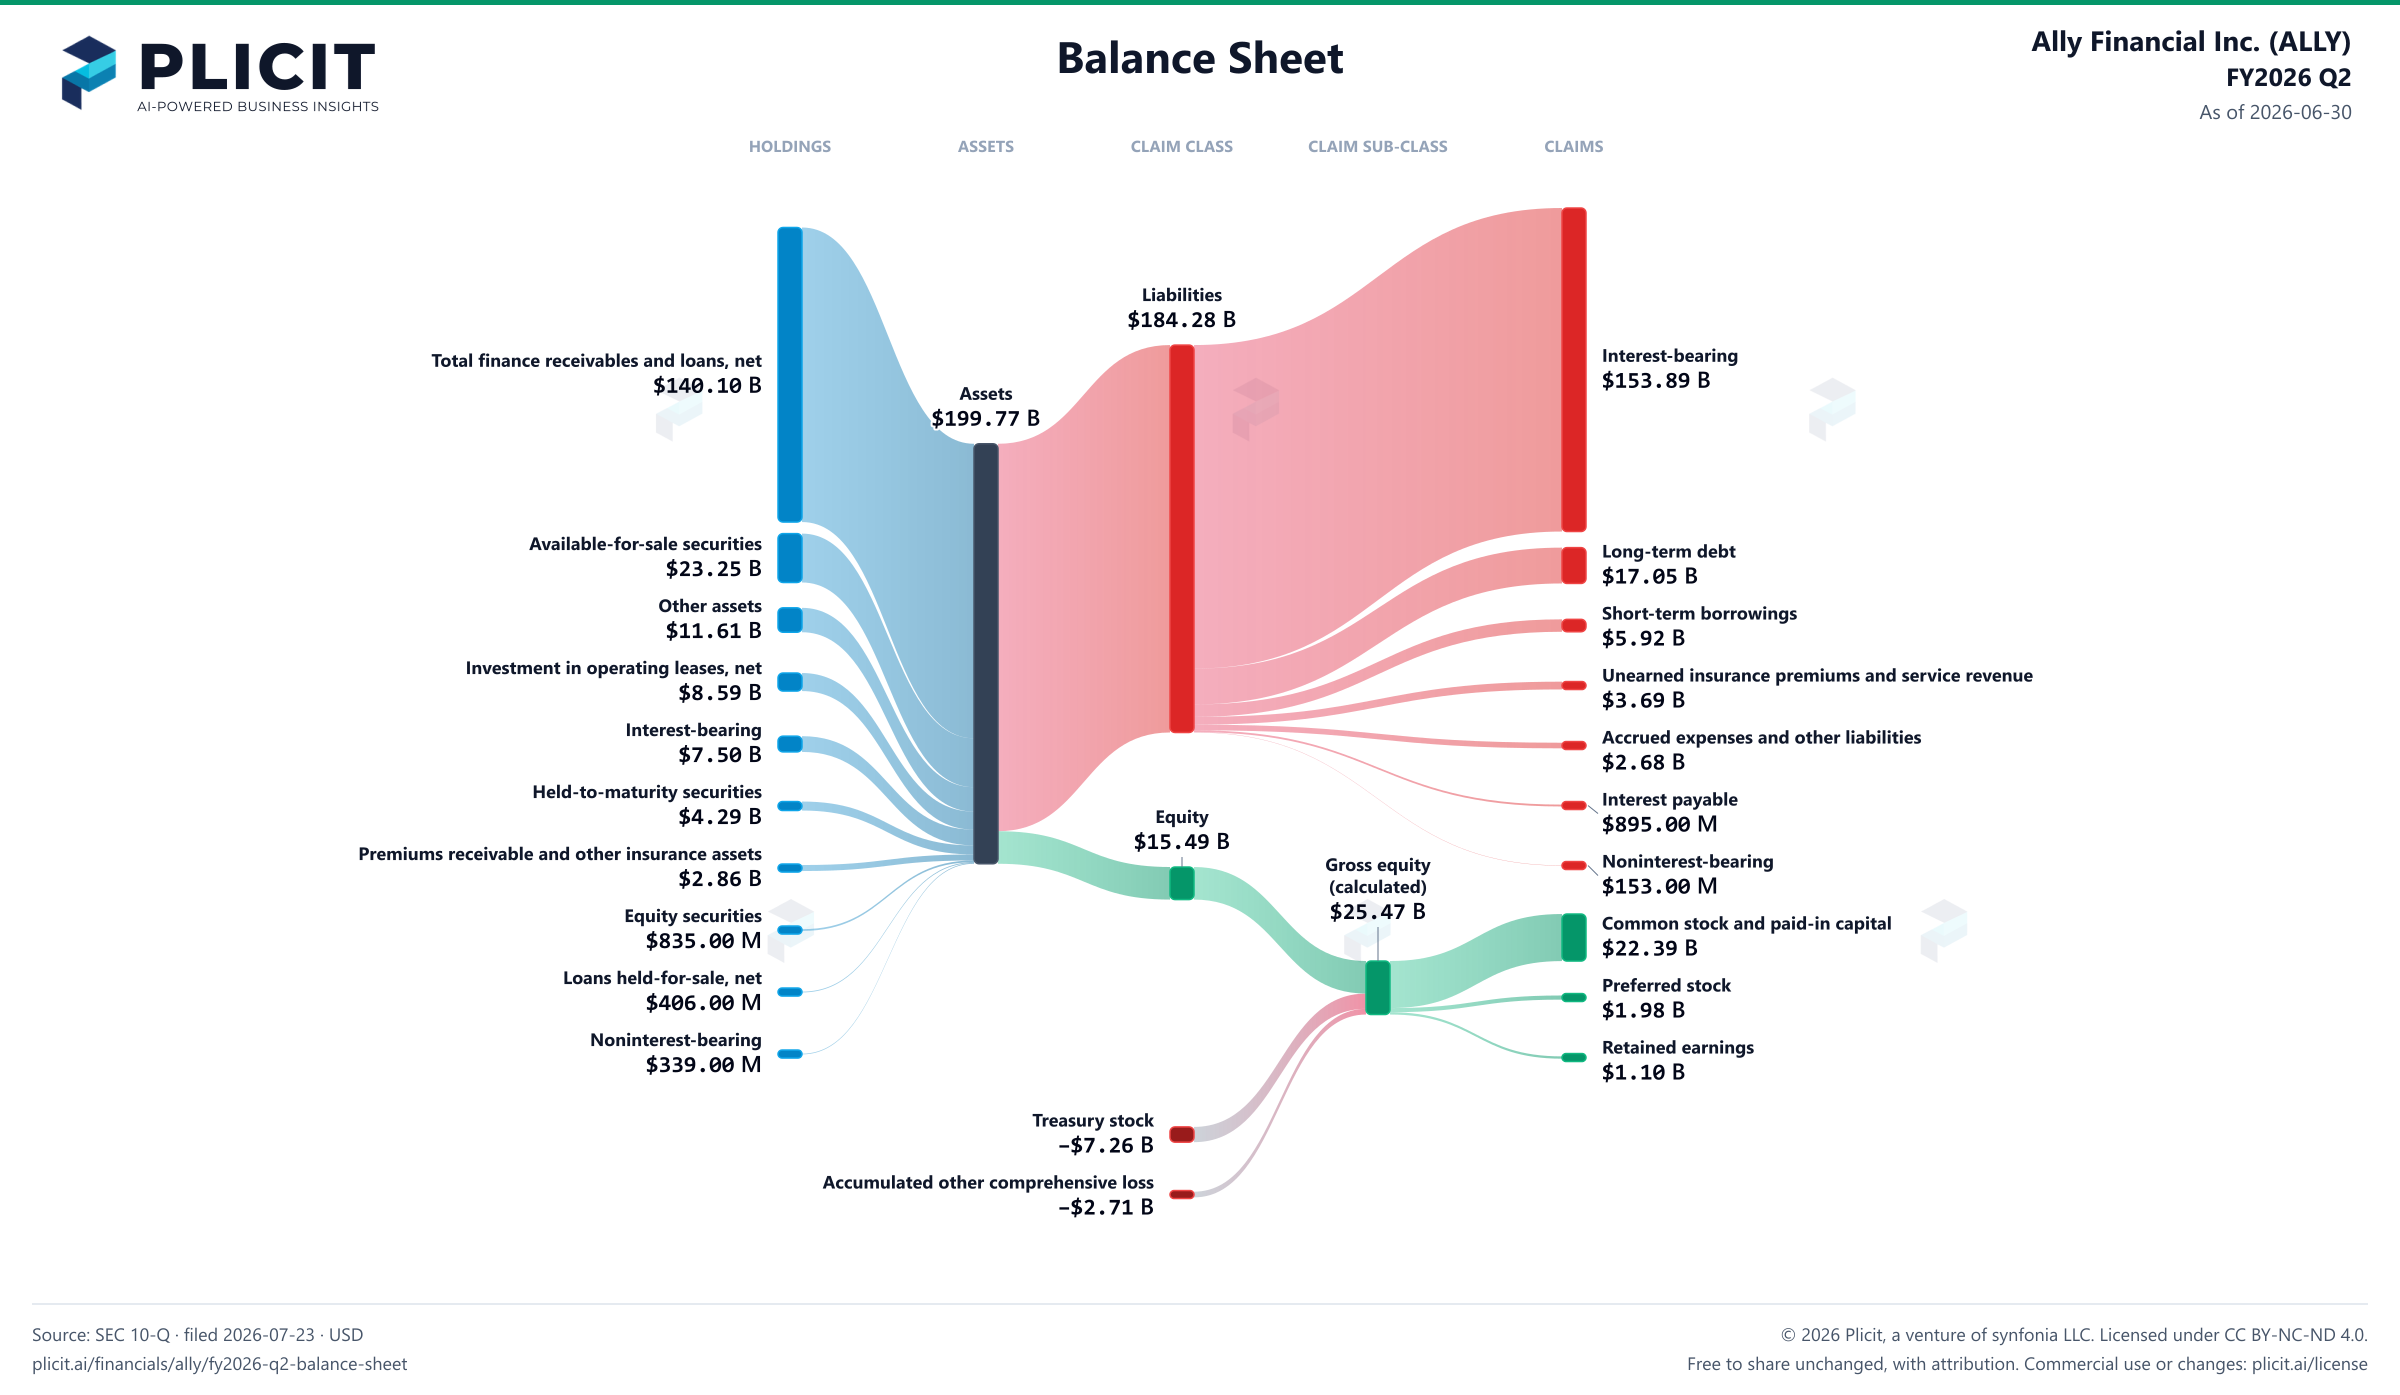
Balance sheet as of 2026-06-30. The chart shows assets, liabilities and equity at that date.
- Assets
- 199,772,000,000 US dollars
- Liabilities
- 184,281,000,000 US dollars
- Equity
- 15,491,000,000 US dollars
- Finance receivables and loans, net of unearned income
- 143,673,000,000 US dollars. Part of Total finance receivables and loans, net, drawn as one net amount.
- Allowance for loan losses
- negative 3,576,000,000 US dollars. Part of Total finance receivables and loans, net, drawn as one net amount.
- Total finance receivables and loans, net
- 140,097,000,000 US dollars
- Available-for-sale securities (amortized cost basis of $26,222 and $25,825)
- 23,253,000,000 US dollars
- Other assets
- 11,610,000,000 US dollars
- Investment in operating leases, net
- 8,585,000,000 US dollars
- Interest-bearing
- 7,501,000,000 US dollars
- Held-to-maturity securities (fair value of $4,299 and $4,451)
- 4,286,000,000 US dollars
- Premiums receivable and other insurance assets
- 2,860,000,000 US dollars
- Equity securities
- 835,000,000 US dollars
- Loans held-for-sale, net
- 406,000,000 US dollars
- Noninterest-bearing
- 339,000,000 US dollars
- Interest-bearing
- 153,893,000,000 US dollars
- Long-term debt
- 17,053,000,000 US dollars
- Short-term borrowings
- 5,916,000,000 US dollars
- Unearned insurance premiums and service revenue
- 3,693,000,000 US dollars
- Accrued expenses and other liabilities
- 2,678,000,000 US dollars
- Interest payable
- 895,000,000 US dollars
- Noninterest-bearing
- 153,000,000 US dollars
- Common stock and paid-in capital ($0.01 par value, shares authorized 1,100,000,000; issued 523,401,995 and 520,355,804; and outstanding 304,542,540 and 308,492,929)
- 22,388,000,000 US dollars
- Preferred stock
- 1,976,000,000 US dollars
- Retained earnings
- 1,101,000,000 US dollars
- Treasury stock, at cost (218,859,455 and 211,862,875 shares)
- negative 7,263,000,000 US dollars
- Accumulated other comprehensive loss
- negative 2,711,000,000 US dollars
- Gross equity (calculated)
- 25,465,000,000 US dollars. Net equity plus the magnitudes of its negative contributions equals gross positive equity. The negative contributions enter this reconciliation as add-backs; their filed signs stay negative.
Chart connections
- Assets equal liabilities plus consolidated equity. Consolidated equity includes noncontrolling interests when reported.
- Treasury shares and other negative equity contributions reduce equity.
Free to share unchanged, with credit to Plicit.ai · CC BY-NC-ND 4.0Download PNG
Product waitlist
Health Check and Teardown for your own company
A health check uncovers insights of your private books, not a public ticker. Join this list to get notified as soon as we go-live!