
AMN HEALTHCARE SERVICES, INC. (AMN) FY2026 Q2 Balance Sheet

Balance Sheet

As of 2026-06-30

Swipe to see the full flow
AMN HEALTHCARE SERVICES, INC. (AMN) FY2026 Q2 Balance SheetBalance sheet as of 2026-06-30. The chart shows assets, liabilities and equity at that date.Current liabilities$770.49 MCurrent assets$869.26 MLiabilities$1.62 BNon-current liabilities$852.21 MAssets$2.36 BEquity$741.28 MNon-current assets$1.49 BHOLDINGSASSET CLASSASSETSCLAIM CLASSCLAIM SUB-CLASSCLAIMSAccounts receivable, net of allowances of $11,519 and $16,580 at June 30, 2026 and December 31, 2025, respectivelyCash and cash equivalentsOther current assetsAccounts receivable, subcontractorPrepaid expensesGoodwillOther assetsIntangible assets, net of accumulated amortization of $597,036 and $561,590 at June 30, 2026 and December 31, 2025, respectivelyFixed assets, net of accumulated depreciation of $373,644 and $414,797 at June 30, 2026 and December 31, 2025, respectivelyDeferred income taxes, netRestricted cash, cash equivalents and investmentsAccrued compensation and benefitsOther current liabilitiesAccounts payable and accrued expensesNotes payable, net of unamortized fees and premiumOther long-term liabilitiesRetained earningsAdditional paid-in capitalCommon stock, $0.01 par value; 200,000 shares authorized; 51,414 issued and 38,716 outstanding at June 30, 2026 and 51,054 issued and 38,441 outstanding at December 31, 2025Accumulated other comprehensive incomeTreasury stock, at cost; 12,698 and 12,613 shares at June 30, 2026 and December 31, 2025, respectivelyCurrent assetsNon-current assetsAssetsCurrent liabilitiesNon-current liabilitiesLiabilitiesEquityEquityAccounts receivable, net of allowances of $11,519 and $16,580 at June 30, 2026 and December 31, 2025, respectivelyAccounts receivable, net$382.51 MAccrued compensation and benefitsAccrued compensation and benefits$325.03 MCurrent liabilitiesCurrent liabilities$770.49 MCurrent assetsCurrent assets$869.26 MLiabilitiesLiabilities$1.62 BOther current liabilitiesOther current liabilities$252.25 MCash and cash equivalentsCash and cash equivalents$361.84 MAccounts payable and accrued expensesAccounts payable and accrued expenses$193.21 MOther current assetsOther current assets$62.10 MNon-current liabilitiesNon-current liabilities$852.21 MAccounts receivable, subcontractorAccounts receivable, subcontractor$42.17 MNotes payable, net of unamortized fees and premiumNotes payable, net of unamortized fees and premium$742.94 MAssetsAssets$2.36 BPrepaid expensesPrepaid expenses$20.65 MOther long-term liabilitiesOther long-term liabilities$109.28 MRetained earningsRetained earnings$1.29 BGoodwillGoodwill$759.00 MEquityEquity$741.28 MNon-current assetsNon-current assets$1.49 BOther assetsOther assets$280.80 MAdditional paid-in capitalAdditional paid-in capital$577.73 MIntangible assets, net of accumulated amortization of $597,036 and $561,590 at June 30, 2026 and December 31, 2025, respectivelyIntangible assets, net$250.09 MCommon stock, $0.01 par value; 200,000 shares authorized; 51,414 issued and 38,716 outstanding at June 30, 2026 and 51,054 issued and 38,441 outstanding at December 31, 2025Common stock$514.00 KAccumulated other comprehensive incomeAccumulated other comprehensive income$8.00 KFixed assets, net of accumulated depreciation of $373,644 and $414,797 at June 30, 2026 and December 31, 2025, respectivelyFixed assets, net$117.34 MDeferred income taxes, netDeferred income taxes, net$47.78 MTreasury stock, at cost; 12,698 and 12,613 shares at June 30, 2026 and December 31, 2025, respectivelyBought back (treasury stock)−$1.13 BRestricted cash, cash equivalents and investmentsRestricted cash, cash equivalents and investments$39.70 M
Chart details

AMN HEALTHCARE SERVICES, INC. (AMN) FY2026 Q2 Balance Sheet

Balance sheet as of 2026-06-30. The chart shows assets, liabilities and equity at that date.

Assets
2,363,977,000 US dollars
Current assets
869,255,000 US dollars
Non-current assets
1,494,722,000 US dollars
Liabilities
1,622,699,000 US dollars
Current liabilities
770,489,000 US dollars
Non-current liabilities
852,210,000 US dollars
Equity
741,278,000 US dollars
Accounts receivable, net of allowances of $11,519 and $16,580 at June 30, 2026 and December 31, 2025, respectively
382,506,000 US dollars
Cash and cash equivalents
361,836,000 US dollars
Other current assets
62,097,000 US dollars
Accounts receivable, subcontractor
42,167,000 US dollars
Prepaid expenses
20,649,000 US dollars
Goodwill
758,999,000 US dollars
Other assets
280,798,000 US dollars
Intangible assets, net of accumulated amortization of $597,036 and $561,590 at June 30, 2026 and December 31, 2025, respectively
250,094,000 US dollars
Fixed assets, net of accumulated depreciation of $373,644 and $414,797 at June 30, 2026 and December 31, 2025, respectively
117,344,000 US dollars
Deferred income taxes, net
47,784,000 US dollars
Restricted cash, cash equivalents and investments
39,703,000 US dollars
Accrued compensation and benefits
325,028,000 US dollars
Other current liabilities
252,249,000 US dollars
Accounts payable and accrued expenses
193,212,000 US dollars
Notes payable, net of unamortized fees and premium
742,935,000 US dollars
Other long-term liabilities
109,275,000 US dollars
Revolving credit facility
0 US dollars
Retained earnings
1,292,320,000 US dollars
Additional paid-in capital
577,732,000 US dollars
Common stock, $0.01 par value; 200,000 shares authorized; 51,414 issued and 38,716 outstanding at June 30, 2026 and 51,054 issued and 38,441 outstanding at December 31, 2025
514,000 US dollars
Accumulated other comprehensive income
8,000 US dollars
Preferred stock, $0.01 par value; 10,000 shares authorized; none issued and outstanding at June 30, 2026 and December 31, 2025
0 US dollars
Treasury stock, at cost; 12,698 and 12,613 shares at June 30, 2026 and December 31, 2025, respectively
negative 1,129,296,000 US dollars

Chart connections

  • Assets equal liabilities plus consolidated equity. Consolidated equity includes noncontrolling interests when reported.
  • Treasury shares and other negative equity contributions reduce equity.
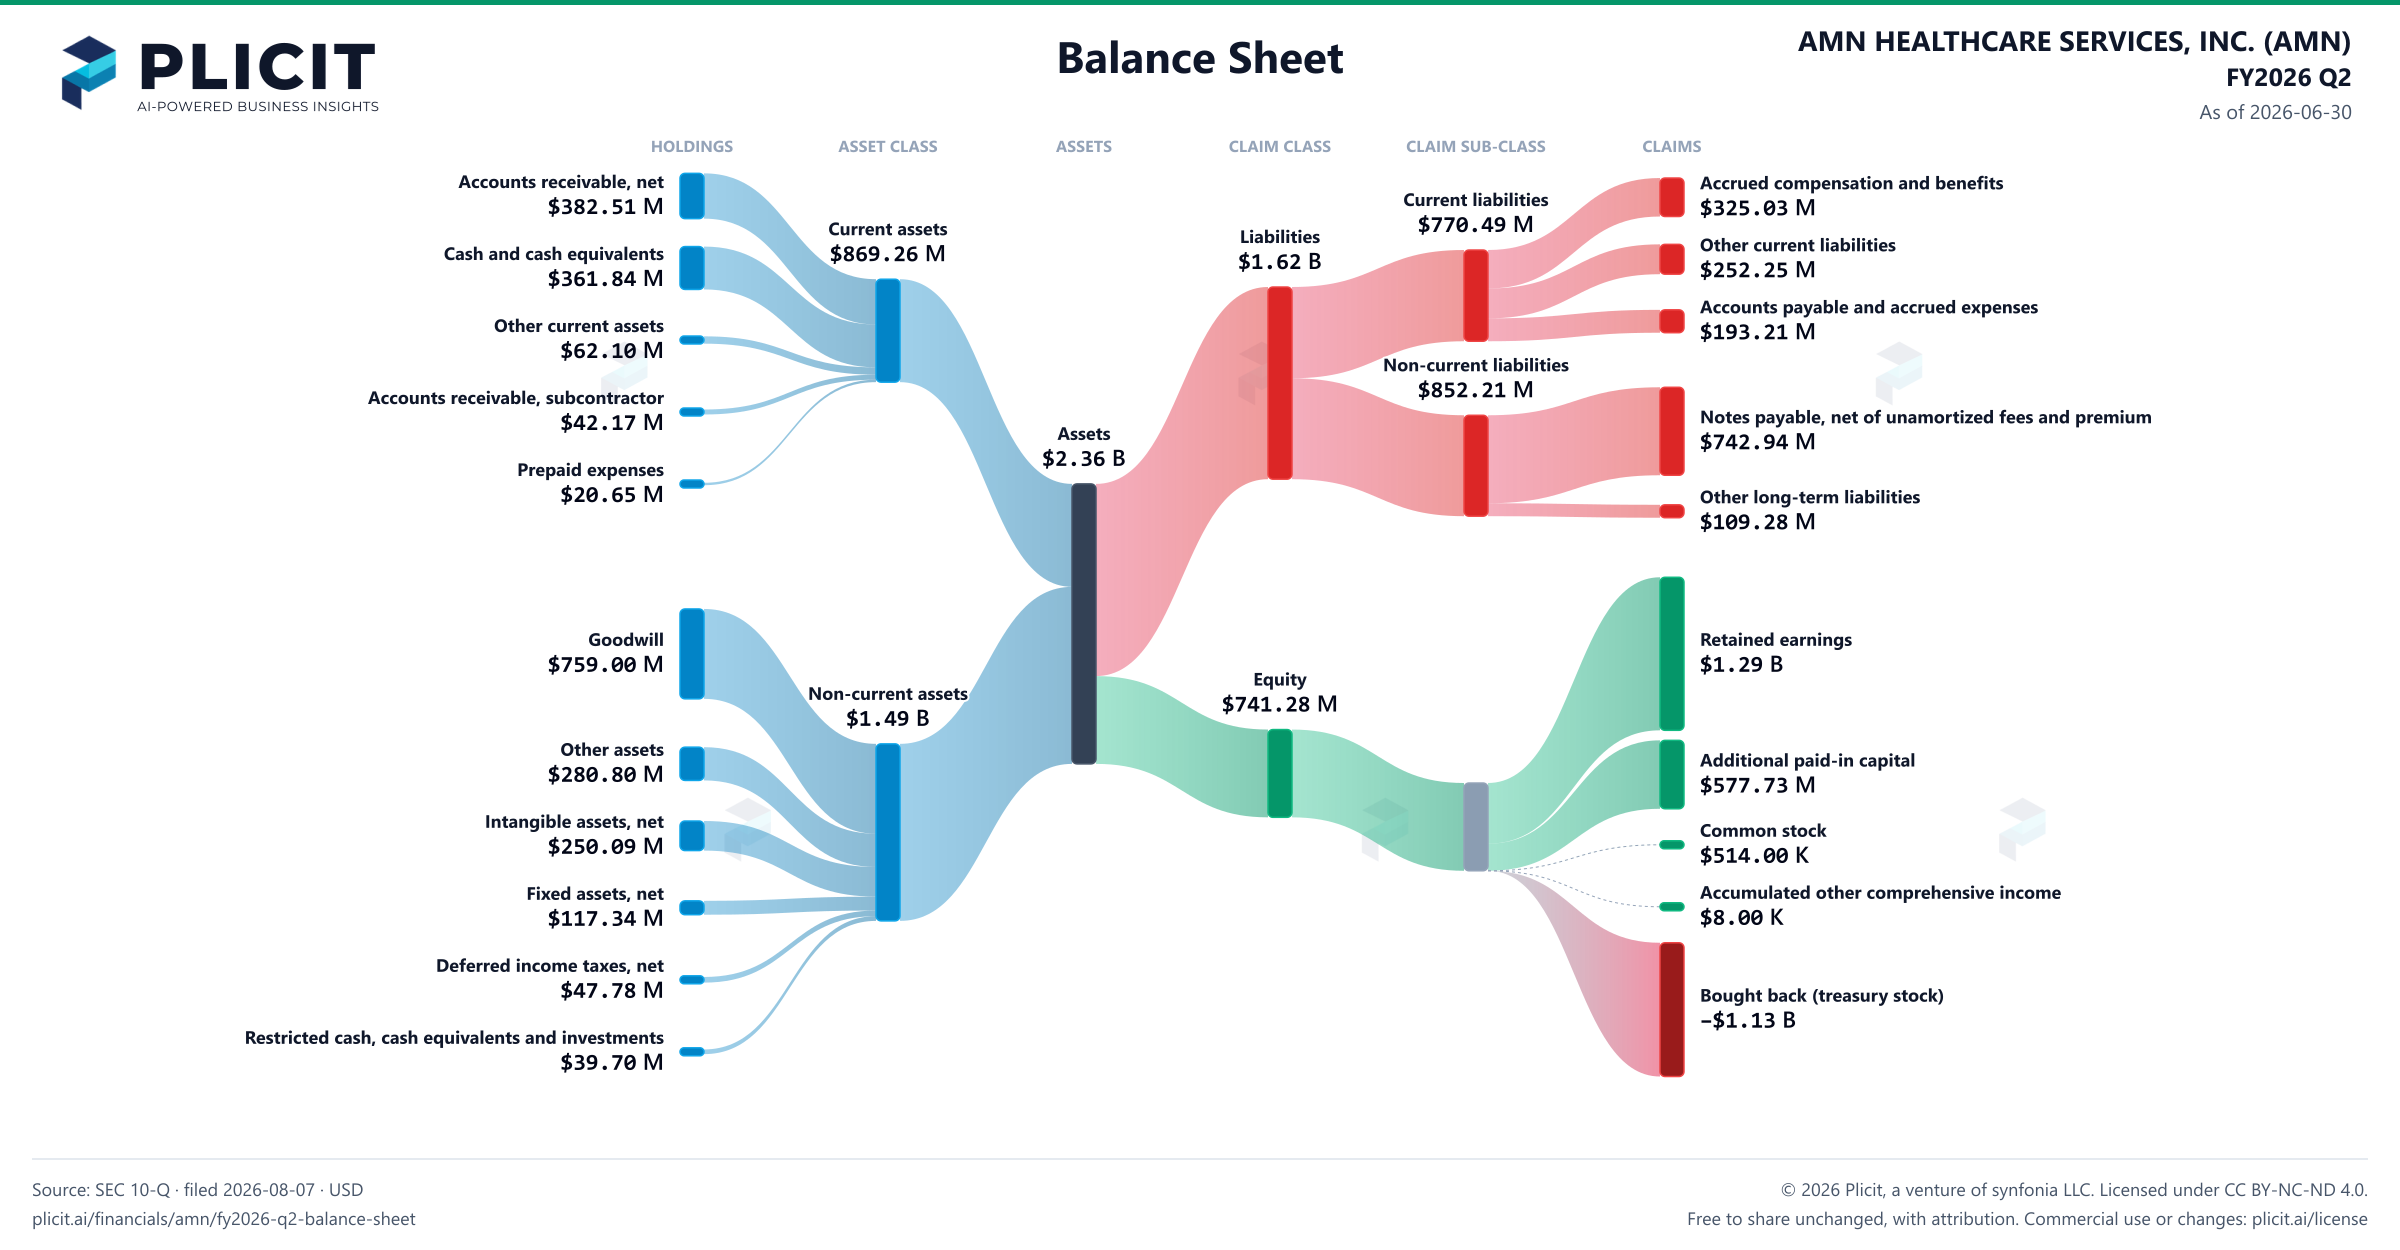
AMN HEALTHCARE SERVICES, INC. (AMN) FY2026 Q2 Balance Sheet Sankey chart
Free to share unchanged, with credit to Plicit.ai · CC BY-NC-ND 4.0Download PNG

Newsletter

Get the teardowns by email

Subscribe if you want the public-company teardowns in your inbox when they're released.

Product waitlist

Health Check and Teardown for your own company

A health check uncovers insights of your private books, not a public ticker. Join this list to get notified as soon as we go-live!