
Andersen Group Inc. (ANDG) FY2026 Q2 Balance Sheet

Balance Sheet

As of 2026-06-30

Swipe to see the full flow
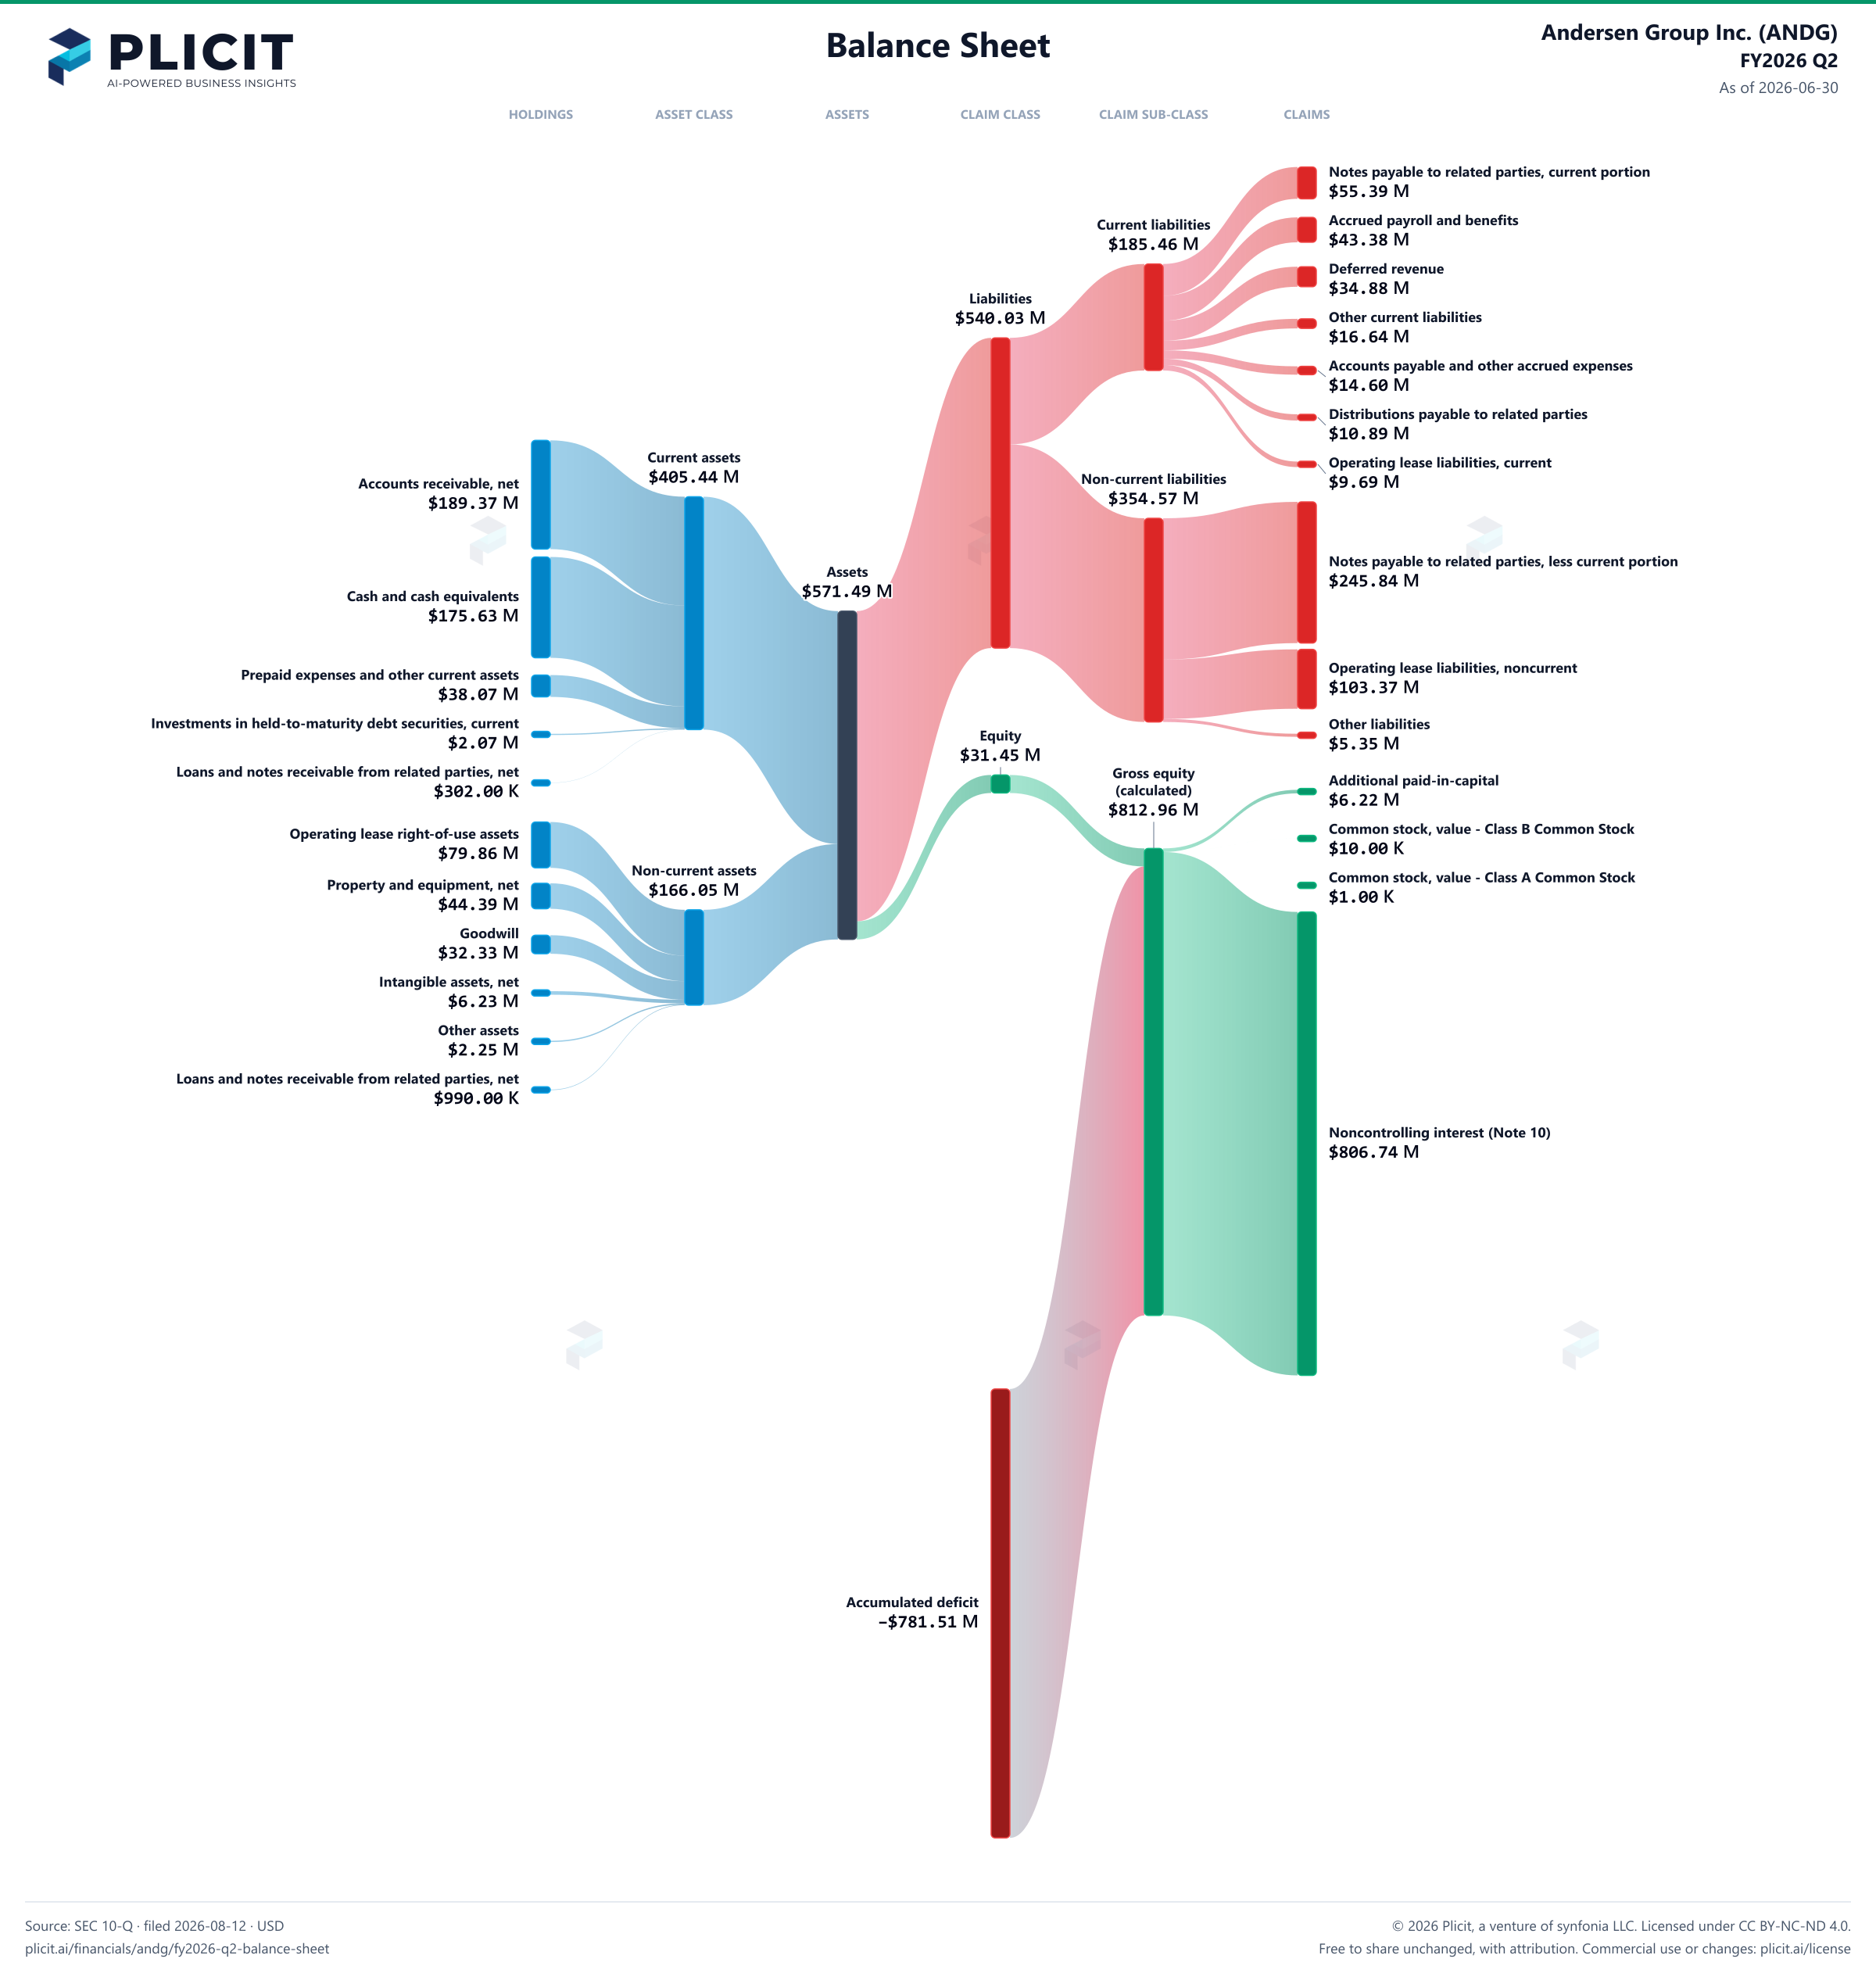
Andersen Group Inc. (ANDG) FY2026 Q2 Balance SheetBalance sheet as of 2026-06-30. The chart shows assets, liabilities and equity at that date.Current liabilities$185.46 MLiabilities$540.03 MCurrent assets$405.44 MNon-current liabilities$354.57 MAssets$571.49 MEquity$31.45 MGross equity(calculated)$812.96 MNon-current assets$166.05 MHOLDINGSASSET CLASSASSETSCLAIM CLASSCLAIM SUB-CLASSCLAIMSAccounts receivable, net of allowance for credit losses of $3,977 and $1,676, respectivelyCash and cash equivalentsPrepaid expenses and other current assetsInvestments in held-to-maturity debt securities, currentLoans and notes receivable from related parties, net of allowance for credit losses of $2,887 and $2,513, respectivelyOperating lease right-of-use assetsProperty and equipment, netGoodwillIntangible assets, netOther assetsLoans and notes receivable from related parties, net of allowance for credit losses of $3,922 and $8,222, respectivelyNotes payable to related parties, current portionAccrued payroll and benefitsDeferred revenueOther current liabilitiesAccounts payable and other accrued expensesDistributions payable to related partiesOperating lease liabilities, currentNotes payable to related parties, less current portionOperating lease liabilities, noncurrentOther liabilitiesAdditional paid-in-capitalCommon stock, value - Class B Common StockCommon stock, value - Class A Common StockNoncontrolling interest (Note 10)Current assetsNon-current assetsAssetsCurrent liabilitiesNon-current liabilitiesLiabilitiesEquityGross equity (calculated)Accumulated deficitNotes payable to related parties, current portionNotes payable to related parties, current portion$55.39 MAccrued payroll and benefitsAccrued payroll and benefits$43.38 MCurrent liabilitiesCurrent liabilities$185.46 MDeferred revenueDeferred revenue$34.88 MLiabilitiesLiabilities$540.03 MOther current liabilitiesOther current liabilities$16.64 MAccounts payable and other accrued expensesAccounts payable and other accrued expenses$14.60 MDistributions payable to related partiesDistributions payable to related parties$10.89 MOperating lease liabilities, currentOperating lease liabilities, current$9.69 MCurrent assetsCurrent assets$405.44 MNon-current liabilitiesNon-current liabilities$354.57 MAccounts receivable, net of allowance for credit losses of $3,977 and $1,676, respectivelyAccounts receivable, net$189.37 MNotes payable to related parties, less current portionNotes payable to related parties, less current portion$245.84 MAssetsAssets$571.49 MCash and cash equivalentsCash and cash equivalents$175.63 MOperating lease liabilities, noncurrentOperating lease liabilities, noncurrent$103.37 MPrepaid expenses and other current assetsPrepaid expenses and other current assets$38.07 MInvestments in held-to-maturity debt securities, currentInvestments in held-to-maturity debt securities, current$2.07 MOther liabilitiesOther liabilities$5.35 MEquityEquity$31.45 MLoans and notes receivable from related parties, net of allowance for credit losses of $2,887 and $2,513, respectivelyLoans and notes receivable from related parties, net$302.00 KAdditional paid-in-capitalAdditional paid-in-capital$6.22 MGross equity (calculated)Gross equity(calculated)$812.96 MCommon stock, value - Class B Common StockCommon stock, value - Class B Common Stock$10.00 KOperating lease right-of-use assetsOperating lease right-of-use assets$79.86 MNon-current assetsNon-current assets$166.05 MCommon stock, value - Class A Common StockCommon stock, value - Class A Common Stock$1.00 KProperty and equipment, netProperty and equipment, net$44.39 MGoodwillGoodwill$32.33 MIntangible assets, netIntangible assets, net$6.23 MOther assetsOther assets$2.25 MLoans and notes receivable from related parties, net of allowance for credit losses of $3,922 and $8,222, respectivelyLoans and notes receivable from related parties, net$990.00 KNoncontrolling interest (Note 10)Noncontrolling interest (Note 10)$806.74 MAccumulated deficitAccumulated deficit−$781.51 M
Chart details

Andersen Group Inc. (ANDG) FY2026 Q2 Balance Sheet

Balance sheet as of 2026-06-30. The chart shows assets, liabilities and equity at that date.

Assets
571,487,000 US dollars
Current assets
405,441,000 US dollars
Non-current assets
166,046,000 US dollars
Liabilities
540,033,000 US dollars
Current liabilities
185,463,000 US dollars
Non-current liabilities
354,570,000 US dollars
Equity
31,454,000 US dollars
Redeemable noncontrolling interest (Note 10)
0 US dollars
Noncontrolling interest
806,737,000 US dollars. Included in consolidated equity; this amount is not added again.
Accounts receivable, net of allowance for credit losses of $3,977 and $1,676, respectively
189,371,000 US dollars
Cash and cash equivalents
175,631,000 US dollars
Prepaid expenses and other current assets
38,067,000 US dollars
Investments in held-to-maturity debt securities, current
2,070,000 US dollars
Loans and notes receivable from related parties, net of allowance for credit losses of $2,887 and $2,513, respectively
302,000 US dollars
Operating lease right-of-use assets
79,864,000 US dollars
Property and equipment, net
44,389,000 US dollars
Goodwill
32,326,000 US dollars
Intangible assets, net
6,226,000 US dollars
Other assets
2,251,000 US dollars
Loans and notes receivable from related parties, net of allowance for credit losses of $3,922 and $8,222, respectively
990,000 US dollars
Notes payable to related parties, current portion
55,391,000 US dollars
Accrued payroll and benefits
43,376,000 US dollars
Deferred revenue
34,880,000 US dollars
Other current liabilities
16,643,000 US dollars
Accounts payable and other accrued expenses
14,601,000 US dollars
Distributions payable to related parties
10,886,000 US dollars
Operating lease liabilities, current
9,686,000 US dollars
Notes payable to related parties, less current portion
245,843,000 US dollars
Operating lease liabilities, noncurrent
103,374,000 US dollars
Other liabilities
5,353,000 US dollars
Additional paid-in-capital
6,215,000 US dollars
Common stock, value - Class B Common Stock
10,000 US dollars
Common stock, value - Class A Common Stock
1,000 US dollars
Preferred stock, par value $0.0001 per share: 100,000,000 shares authorized, no shares issued and outstanding as of June 30, 2026 and December 31, 2025
0 US dollars
Noncontrolling interest (Note 10)
806,737,000 US dollars
Accumulated deficit
negative 781,509,000 US dollars
Gross equity (calculated)
812,963,000 US dollars. Net equity plus the magnitudes of its negative contributions equals gross positive equity. The negative contributions enter this reconciliation as add-backs; their filed signs stay negative.

Chart connections

  • Assets equal liabilities plus temporary equity plus consolidated equity. Consolidated equity includes noncontrolling interests when reported.
  • Treasury shares and other negative equity contributions reduce equity.
Andersen Group Inc. (ANDG) FY2026 Q2 Balance Sheet Sankey chart
Free to share unchanged, with credit to Plicit.ai · CC BY-NC-ND 4.0Download PNG

Newsletter

Get the teardowns by email

Subscribe if you want the public-company teardowns in your inbox when they're released.

Product waitlist

Health Check and Teardown for your own company

A health check uncovers insights of your private books, not a public ticker. Join this list to get notified as soon as we go-live!