
AIR PRODUCTS AND CHEMICALS, INC. (APD) FY2024 Annual Balance Sheet

Balance Sheet

As of 2024-09-30

Swipe to see the full flow
AIR PRODUCTS AND CHEMICALS, INC. (APD) FY2024 Annual Balance SheetBalance sheet as of 2024-09-30. The chart shows assets, liabilities and equity at that date.Current liabilities$4.18 BCurrent assets$6.36 BLiabilities$20.90 BAssets$39.57 BNon-current liabilities$16.72 BNon-current assets$33.21 BEquity$18.67 BGross equity(calculated)$22.69 BHOLDINGSASSET CLASSASSETSCLAIM CLASSCLAIM SUB-CLASSCLAIMSCash and cash itemsTrade receivables, netInventoriesOther receivables and current assetsPrepaid expensesShort-term investmentsPlant and equipment, netInvestment in net assets of and advances to equity affiliatesFinancing receivablesOther noncurrent assetsOperating lease right-of-use assets, netGoodwill, netNoncurrent lease receivablesIntangible assets, netPayables and accrued liabilitiesCurrent portion of long-term debtAccrued income taxesShort-term borrowingsLess: Long-term debt – related party - Nonrelated PartyOther noncurrent liabilitiesDeferred income taxesNoncurrent operating lease liabilitiesLess: Long-term debt – related party - Related PartyRetained earningsCapital in excess of par valueCommon stock (par value $1 per share; issued 2024 and 2023 - 249,455,584 shares)Noncontrolling interestsCurrent assetsNon-current assetsAssetsCurrent liabilitiesNon-current liabilitiesLiabilitiesEquityGross equity (calculated)Accumulated other comprehensive lossTreasury stock, at cost (2024 - 27,083,166 shares; 2023 - 27,255,739 shares)Cash and cash itemsCash and cash items$2.98 BPayables and accrued liabilitiesPayables and accrued liabilities$2.93 BCurrent liabilitiesCurrent liabilities$4.18 BTrade receivables, netTrade receivables, net$1.82 BCurrent portion of long-term debtCurrent portion of long-term debt$611.40 MCurrent assetsCurrent assets$6.36 BInventoriesInventories$766.00 MAccrued income taxesAccrued income taxes$558.50 MLiabilitiesLiabilities$20.90 BOther receivables and current assetsOther receivables and current assets$610.80 MShort-term borrowingsShort-term borrowings$83.50 MPrepaid expensesPrepaid expenses$179.90 MAssetsAssets$39.57 BNon-current liabilitiesNon-current liabilities$16.72 BShort-term investmentsShort-term investments$5.00 MLess: Long-term debt – related party - Nonrelated PartyLess: Long-term debt – related party - Nonrelated Party$13.43 BOther noncurrent liabilitiesOther noncurrent liabilities$1.35 BDeferred income taxesDeferred income taxes$1.16 BPlant and equipment, netPlant and equipment, net$23.37 BNon-current assetsNon-current assets$33.21 BNoncurrent operating lease liabilitiesNoncurrent operating lease liabilities$677.90 MEquityEquity$18.67 BLess: Long-term debt – related party - Related PartyLess: Long-term debt – related party - Related Party$104.40 MInvestment in net assets of and advances to equity affiliatesInvestment in net assets of andadvances to equity affiliates$4.79 BGross equity (calculated)Gross equity(calculated)$22.69 BFinancing receivablesFinancing receivables$1.22 BRetained earningsRetained earnings$19.55 BOther noncurrent assetsOther noncurrent assets$1.17 BOperating lease right-of-use assets, netOperating lease right-of-use assets, net$1.05 BCapital in excess of par valueCapital in excess of par value$1.25 BGoodwill, netGoodwill, net$905.10 MCommon stock (par value $1 per share; issued 2024 and 2023 - 249,455,584 shares)Common stock$249.40 MNoncurrent lease receivablesNoncurrent lease receivables$392.10 MNoncontrolling interestsNoncontrolling interests$1.64 BIntangible assets, netIntangible assets, net$311.60 MAccumulated other comprehensive lossAccumulated other comprehensive loss−$2.03 BTreasury stock, at cost (2024 - 27,083,166 shares; 2023 - 27,255,739 shares)Treasury stock−$1.98 B
Chart details

AIR PRODUCTS AND CHEMICALS, INC. (APD) FY2024 Annual Balance Sheet

Balance sheet as of 2024-09-30. The chart shows assets, liabilities and equity at that date.

Assets
39,574,600,000 US dollars
Current assets
6,363,000,000 US dollars
Non-current assets
33,211,600,000 US dollars
Liabilities
20,900,900,000 US dollars
Current liabilities
4,179,600,000 US dollars
Non-current liabilities
16,721,300,000 US dollars
Equity
18,673,700,000 US dollars
Noncontrolling interest
1,637,200,000 US dollars. Included in consolidated equity; this amount is not added again.
Cash and cash items
2,979,700,000 US dollars
Trade receivables, net
1,821,600,000 US dollars
Inventories
766,000,000 US dollars
Other receivables and current assets
610,800,000 US dollars
Prepaid expenses
179,900,000 US dollars
Short-term investments
5,000,000 US dollars
Plant and equipment, net
23,370,900,000 US dollars
Investment in net assets of and advances to equity affiliates
4,792,500,000 US dollars
Financing receivables
1,220,200,000 US dollars
Other noncurrent assets
1,171,500,000 US dollars
Operating lease right-of-use assets, net
1,047,700,000 US dollars
Goodwill, net
905,100,000 US dollars
Noncurrent lease receivables
392,100,000 US dollars
Intangible assets, net
311,600,000 US dollars
Payables and accrued liabilities
2,926,200,000 US dollars
Current portion of long-term debt
611,400,000 US dollars
Accrued income taxes
558,500,000 US dollars
Short-term borrowings
83,500,000 US dollars
Less: Long-term debt – related party - Nonrelated Party
13,428,600,000 US dollars
Other noncurrent liabilities
1,350,500,000 US dollars
Deferred income taxes
1,159,900,000 US dollars
Noncurrent operating lease liabilities
677,900,000 US dollars
Less: Long-term debt – related party - Related Party
104,400,000 US dollars
Retained earnings
19,545,700,000 US dollars
Capital in excess of par value
1,253,200,000 US dollars
Common stock (par value $1 per share; issued 2024 and 2023 - 249,455,584 shares)
249,400,000 US dollars
Noncontrolling interests
1,637,200,000 US dollars
Accumulated other comprehensive loss
negative 2,027,700,000 US dollars
Treasury stock, at cost (2024 - 27,083,166 shares; 2023 - 27,255,739 shares)
negative 1,984,100,000 US dollars
Gross equity (calculated)
22,685,500,000 US dollars. Net equity plus the magnitudes of its negative contributions equals gross positive equity. The negative contributions enter this reconciliation as add-backs; their filed signs stay negative.

Chart connections

  • Assets equal liabilities plus consolidated equity. Consolidated equity includes noncontrolling interests when reported.
  • Treasury shares and other negative equity contributions reduce equity.
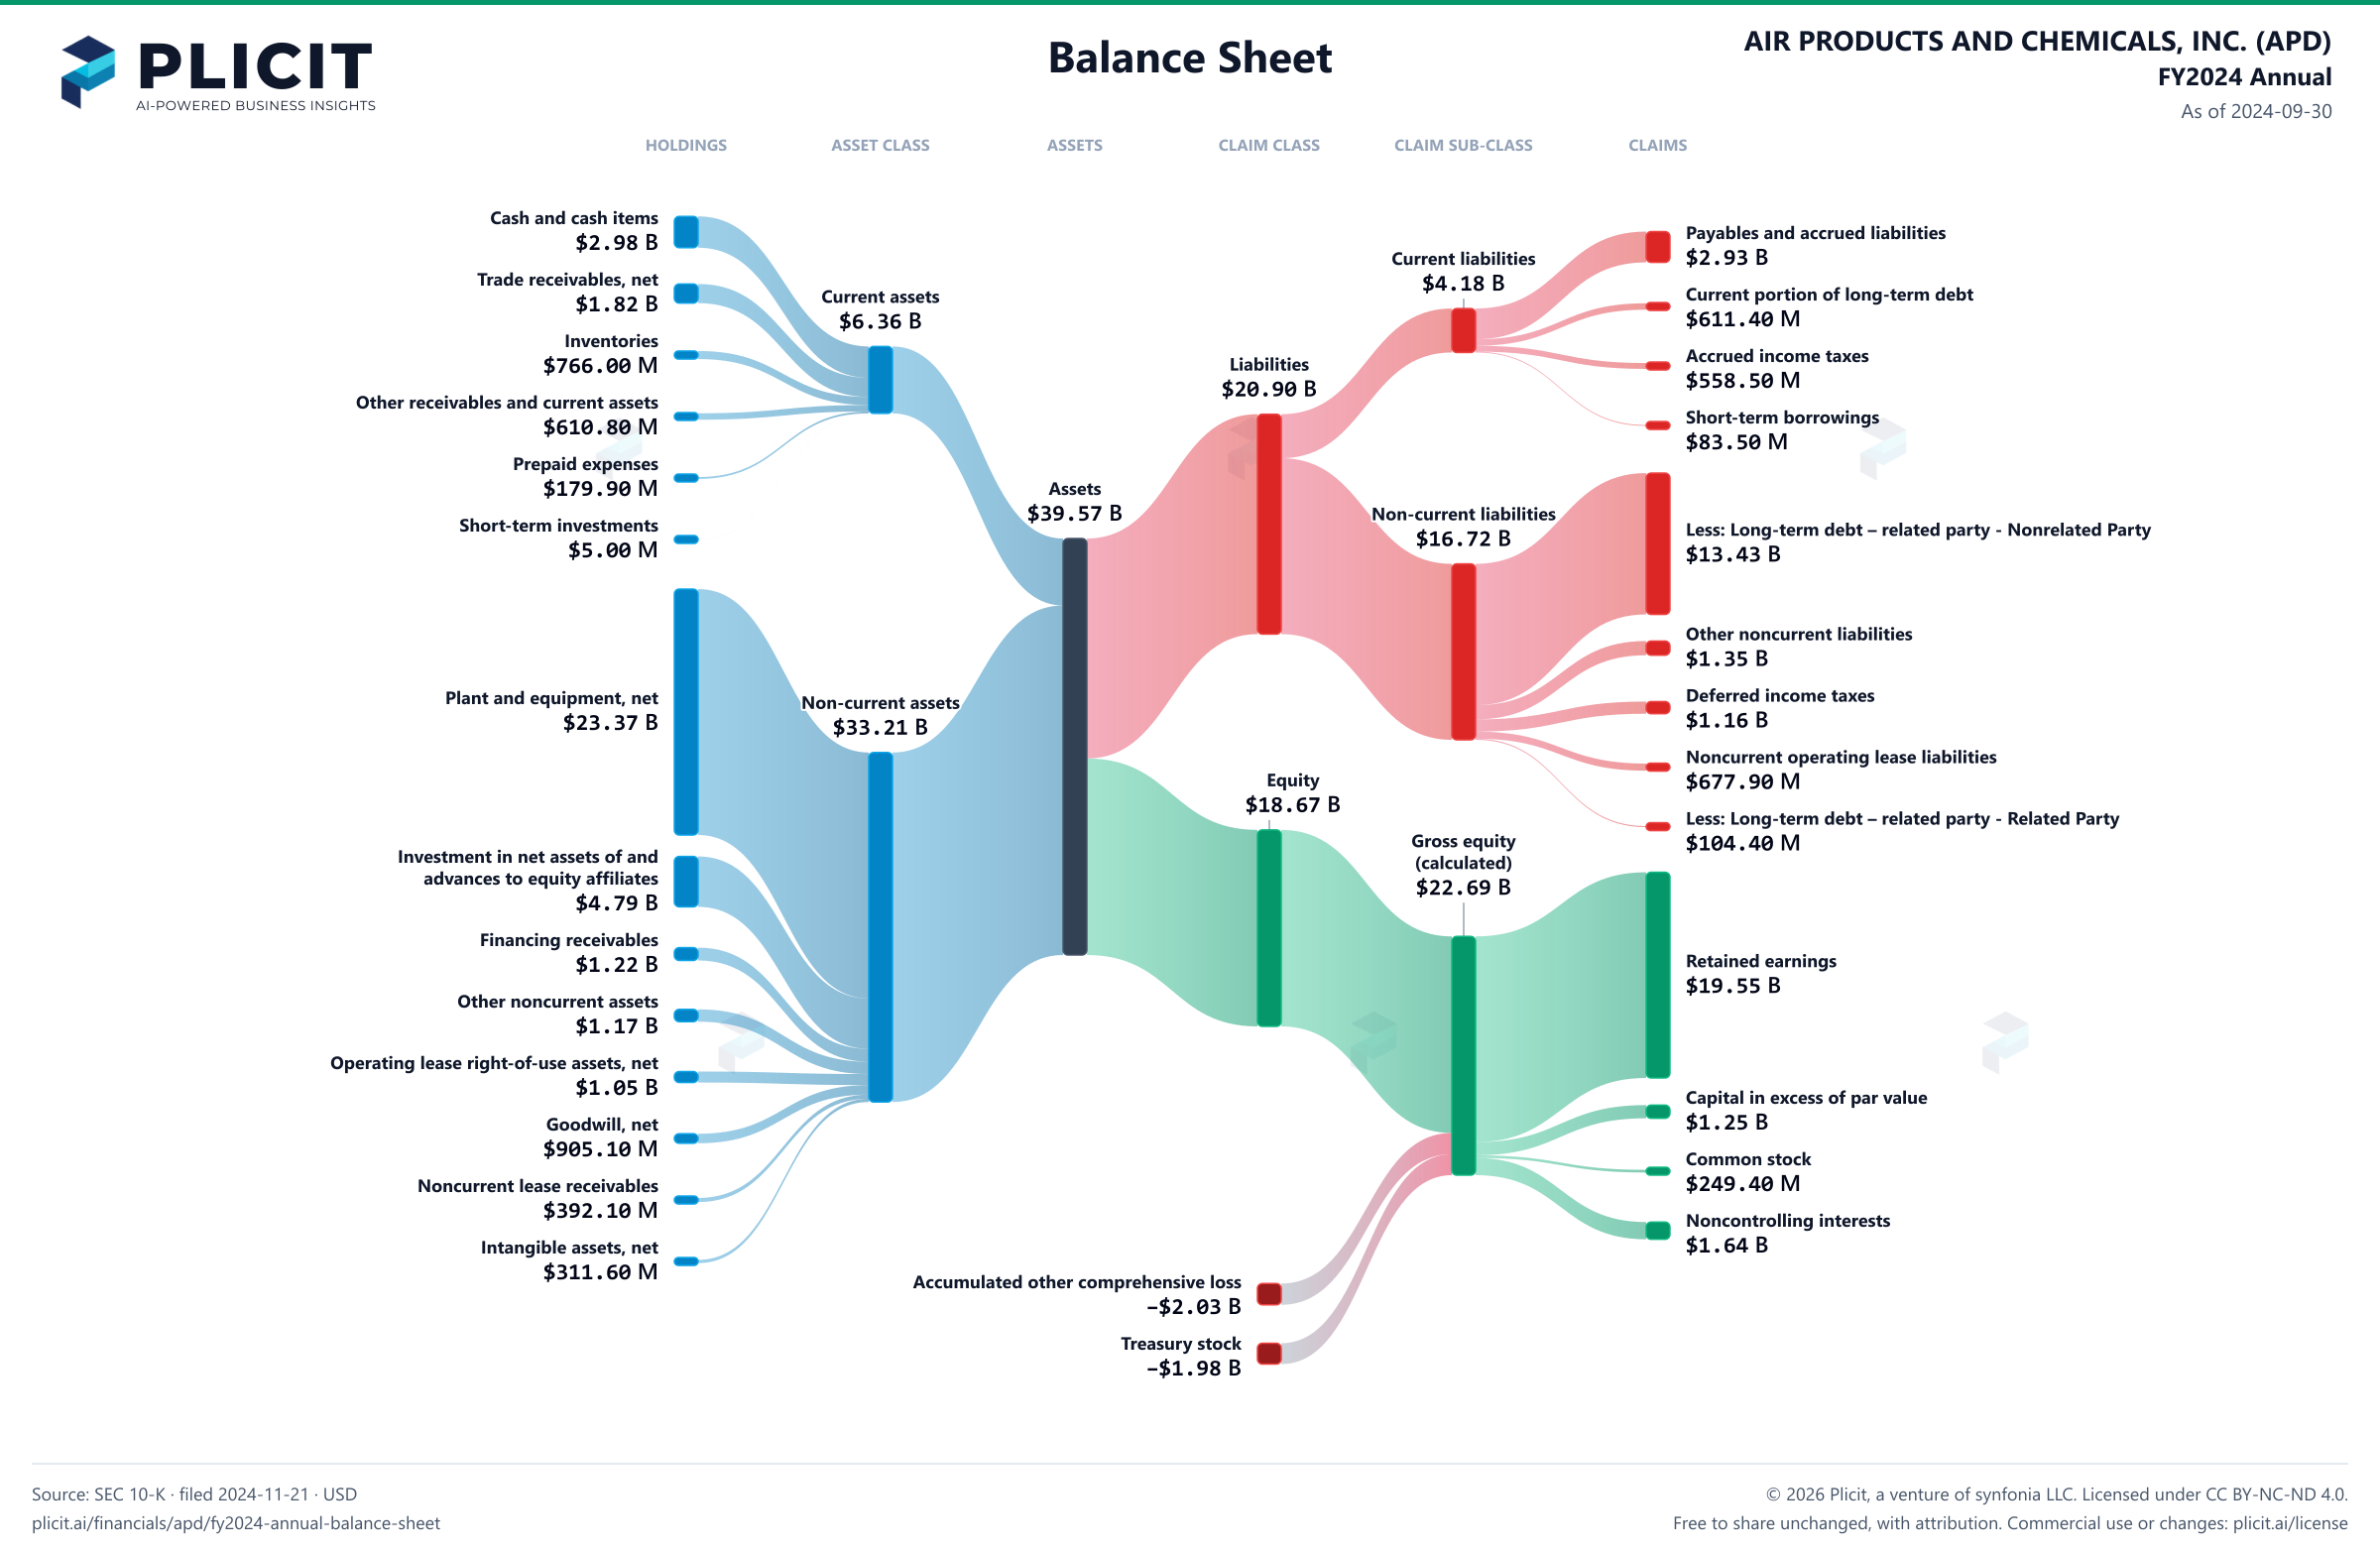
AIR PRODUCTS AND CHEMICALS, INC. (APD) FY2024 Annual Balance Sheet Sankey chart
Free to share unchanged, with credit to Plicit.ai · CC BY-NC-ND 4.0Download PNG

Newsletter

Get the teardowns by email

Subscribe if you want the public-company teardowns in your inbox when they're released.

Product waitlist

Health Check and Teardown for your own company

A health check uncovers insights of your private books, not a public ticker. Join this list to get notified as soon as we go-live!