ANTERO RESOURCES CORPORATION (AR) FY2026 Q3 Statement of Cash Flows

Published · Updated Source: Form 10-Q on SEC EDGAR filed (opens in a new tab)

Key Takeaways

  • Operating cash rose 85% to $575.20 M, while profit rose 329% to $367.14 M.
  • Borrowing reached $5.40 B this quarter, and $5.24 B was repaid in the same period.
  • Capital spending of $314.16 M rose 30%, and buybacks of $55.70 M took 21% of what was left.
  • Average diluted shares fell 0.8% to 308.63 million from a year earlier.
  • Equity-based pay came to $13.15 M, or 2.3% of operating cash, which the cash flow adds back.

The Unvarnished Truth

Antero Resources borrowed $5.40 B in one quarter and repaid $5.24 B

Antero Resources' profit rose 329% this quarter to $367.14 M, but its operating cash rose 85% to $575.20 M. The gap is the story: profit is what the accounts say the company earned, and cash is what reached the bank. The cash flow adds back $242.16 M of depletion, depreciation and amortization, a non-cash charge that lowers profit without touching cash. Operating cash is the number that pays suppliers, lenders and owners, so it is the one to watch.

Borrowing is the other half of the story. Antero Resources raised $5.40 B of new debt this quarter and repaid $5.24 B, a net $166.30 M. Spending on property and equipment took $314.16 M, up 30% from $241.16 M a year earlier. Buybacks took $55.70 M, which is 21% of the cash left after that spending. The repayments are almost as large as the borrowings. Those are choices, and the debt they rest on must be repaid with interest.

Stock pay adds a layer. Equity-based pay for employees came to $13.15 M this quarter, and the cash flow adds it back to operating cash. Diluted shares fell 0.8% to 308.63 million over the year, so buybacks did shrink the count, but only a little. That matters to owners because the share count sets their slice of every future profit. Is operating cash strong enough to pay for the buybacks without new borrowing, or is the borrowing doing that work?

2026-07-01 to 2026-09-30

Statement of Cash Flows

Swipe to see the full flow
ANTERO RESOURCES CORPORATION cash flow reconciliation, Jul 1, 2026 through Sep 30, 2026One connected Sankey reconciles operating, investing and financing net cash flows through a shared cash pool, from beginning cash to ending cash. Ribbons flow left to right on one dollar scale. Activity totals are dark gray; beginning and ending cash are blue. Cash basis for beginning and ending balances and net cash change: Cash, cash equivalents, and restricted cash. Intermediate calculation bars are lighter gray. Net income is green for profit and red for loss. Identified asset purchases, sales and maturities are blue in either cash direction. Purple identifies capital transactions such as borrowing, repayments, share issuance and dividends. Read chart description and values below for full signed amounts, including zero items.Net income including noncontrolling interests → Net cash from operating activities: $367,140,000.00Depletion, depreciation, amortization and accretion → Operating adjustments reconciliation: $242,163,000.00Gains (losses) on settled commodity derivatives → Operating adjustments reconciliation: $135,561,000.00Deferred income tax expense → Operating adjustments reconciliation: $93,010,000.00Dividends of earnings from unconsolidated affiliate → Operating adjustments reconciliation: $31,313,000.00Accrued revenue → Operating adjustments reconciliation: $29,433,000.00Equity-based compensation expense → Operating adjustments reconciliation: $13,152,000.00Prepaid expenses and other current assets → Operating adjustments reconciliation: $12,534,000.00Contract termination, loss contingency and settlements → Operating adjustments reconciliation: $6,612,000.00Other current liabilities → Operating adjustments reconciliation: $4,011,000.00Revenue distributions payable → Operating adjustments reconciliation: $2,091,000.00Impairment of property and equipment → Operating adjustments reconciliation: $1,555,000.00Amortization of debt issuance costs and other → Operating adjustments reconciliation: $382,000.00Operating adjustments reconciliation → Net cash from operating activities: $208,061,000.00Operating adjustments reconciliation → Commodity derivative fair value gains: $188,567,000.00Operating adjustments reconciliation → Equity in earnings of unconsolidated affiliate: $110,710,000.00Operating adjustments reconciliation → Accrued liabilities: $32,933,000.00Operating adjustments reconciliation → Accounts payable including related parties: $22,903,000.00Operating adjustments reconciliation → Amortization of deferred revenue: $5,924,000.00Operating adjustments reconciliation → Accounts receivable: $1,557,000.00Operating adjustments reconciliation → Loss (gain) on sale of assets: $1,153,000.00Operating adjustments reconciliation → Settlement of asset retirement obligations: $9,000.00Issuances and borrowings of debt → financing reconciliation: $5,401,943,000.00financing reconciliation → Net cash from financing activities: $108,648,000.00financing reconciliation → Repayments of debt: $5,235,643,000.00financing reconciliation → Repurchases of common stock: $55,699,000.00financing reconciliation → Payment of debt issuance costs: $1,453,000.00financing reconciliation → Other: $401,000.00financing reconciliation → Employee tax withholding for settlement of equity-based compensation awards: $99,000.00Net cash used in investing activities → investing reconciliation: $683,849,000.00investing reconciliation → Acquisitions of oil and gas properties: $314,161,000.00investing reconciliation → Drilling and completion costs: $311,888,000.00investing reconciliation → Additions to unproved properties: $33,732,000.00investing reconciliation → Additions to other property and equipment: $14,827,000.00investing reconciliation → Change in other assets: $7,397,000.00investing reconciliation → Proceeds from asset sales: $1,844,000.00Net cash from operating activities → Cash sources and uses: $575,201,000.00Net cash from financing activities → Cash sources and uses: $108,648,000.00Cash sources and uses → Net cash used in investing activities: $683,849,000.00Net income including noncontrolling interests: $367,140,000.00Net income including noncontrolling interests+$367.14 MDepletion, depreciation, amortization and accretion: $242,163,000.00Depletion, depreciation, amortization and accretion+$242.16 MImpairment of property and equipment: $1,555,000.00Asset impairments+$1.56 MCommodity derivative fair value gains: -$188,567,000.00Derivative gain & loss−$188.57 MGains (losses) on settled commodity derivatives: $135,561,000.00Gains (losses) on settled commodity derivatives+$135.56 MDeferred income tax expense: $93,010,000.00Deferred income taxes+$93.01 MEquity-based compensation expense: $13,152,000.00Stock-based compensation+$13.15 MEquity in earnings of unconsolidated affiliate: -$110,710,000.00Equity-method results−$110.71 MDividends of earnings from unconsolidated affiliate: $31,313,000.00Equity-method distributions+$31.31 MAmortization of deferred revenue: -$5,924,000.00Amortization of deferred revenue−$5.92 MAmortization of debt issuance costs and other: $382,000.00Debt cost amortization+$382.00 KContract termination, loss contingency and settlements: $6,612,000.00Contract termination, loss contingency andsettlements+$6.61 MSettlement of asset retirement obligations: -$9,000.00Asset retirement payments−$9.00 KLoss (gain) on sale of assets: -$1,153,000.00Asset disposal gain & loss−$1.15 MLoss on early extinguishment of debt: $0.00Accounts receivable: -$1,557,000.00Accounts receivable−$1.56 MAccrued revenue: $29,433,000.00Accrued revenue+$29.43 MPrepaid expenses and other current assets: $12,534,000.00Prepaid & other assets+$12.53 MAccounts payable including related parties: -$22,903,000.00Accounts payable−$22.90 MAccrued liabilities: -$32,933,000.00Accrued liabilities−$32.93 MRevenue distributions payable: $2,091,000.00Revenue distributions payable+$2.09 MOther current liabilities: $4,011,000.00Other current liabilities+$4.01 MNet cash from operating activities: $575,201,000.00Operating cash+$575.20 MOperating adjustments reconciliation: $571,817,000.00Issuances and borrowings of debt: $5,401,943,000.00Debt issued+$5.40 BRepayments of debt: -$5,235,643,000.00Debt repaid−$5.24 BRepurchases of common stock: -$55,699,000.00Common stock repurchases−$55.70 MPayment of debt issuance costs: -$1,453,000.00Debt issuance costs−$1.45 MDistributions to noncontrolling interests in Martica Holdings LLC: $0.00Employee tax withholding for settlement of equity-based compensation awards: -$99,000.00Stock-award tax withholding−$99.00 KOther: -$401,000.00Other financing, net−$401.00 KNet cash from financing activities: $108,648,000.00Financing cash+$108.65 Mfinancing reconciliation: $5,401,943,000.00Acquisition of HG Production: $0.00Acquisitions of oil and gas properties: -$314,161,000.00Oil & gas property purchases−$314.16 MAdditions to unproved properties: -$33,732,000.00Additions to unproved properties−$33.73 MDrilling and completion costs: -$311,888,000.00Oil & gas exploration spending−$311.89 MAdditions to other property and equipment: -$14,827,000.00Other PP&E purchases−$14.83 MProceeds from asset sales: -$1,844,000.00Asset sales−$1.84 MChange in other assets: -$7,397,000.00Change in other assets−$7.40 MNet cash used in investing activities: -$683,849,000.00. Cash required to fund net payments.Investing cash−$683.85 Minvesting reconciliation: $683,849,000.00Cash sources and uses: $683,849,000.00Beginning cash: Cash, cash equivalents, and restricted cash: $0.00Beginning cash$0.00Ending cash: Cash, cash equivalents, and restricted cash: $0.00Ending cash$0.00CASH RECONCILIATIONOperatingflowsFinancingflowsInvestingflowsFree cash flowNot availableCash flow / Net income1.57×Operating cash flow ÷ net incomeNet cash change$0.00Ending cash − beginning cash
Chart details

ANTERO RESOURCES CORPORATION cash flow reconciliation, Jul 1, 2026 through Sep 30, 2026

Cash flows for Jul 1, 2026 through Sep 30, 2026. Cash basis: Cash, cash equivalents, and restricted cash. Beginning cash: Jun 30, 2026. Ending cash: Sep 30, 2026. Beginning and ending cash are dated balances. Positive cash flows add cash; negative cash flows reduce it.

Beginning cash on Jun 30, 2026
0 US dollars. Beginning cash: Cash, cash equivalents, and restricted cash
Operating activities
575,201,000 US dollars. Net cash provided.
Net income including noncontrolling interests
367,140,000 US dollars
Depletion, depreciation, amortization and accretion
242,163,000 US dollars
Impairment of property and equipment
1,555,000 US dollars
Commodity derivative fair value gains
negative 188,567,000 US dollars
Gains (losses) on settled commodity derivatives
135,561,000 US dollars
Deferred income tax expense
93,010,000 US dollars
Equity-based compensation expense
13,152,000 US dollars
Equity in earnings of unconsolidated affiliate
negative 110,710,000 US dollars
Dividends of earnings from unconsolidated affiliate
31,313,000 US dollars
Amortization of deferred revenue
negative 5,924,000 US dollars
Amortization of debt issuance costs and other
382,000 US dollars
Contract termination, loss contingency and settlements
6,612,000 US dollars
Settlement of asset retirement obligations
negative 9,000 US dollars
Loss (gain) on sale of assets
negative 1,153,000 US dollars
Loss on early extinguishment of debt
0 US dollars
Accounts receivable
negative 1,557,000 US dollars
Accrued revenue
29,433,000 US dollars
Prepaid expenses and other current assets
12,534,000 US dollars
Accounts payable including related parties
negative 22,903,000 US dollars
Accrued liabilities
negative 32,933,000 US dollars
Revenue distributions payable
2,091,000 US dollars
Other current liabilities
4,011,000 US dollars
Investing activities
negative 683,849,000 US dollars. Net cash used.
Acquisition of HG Production
0 US dollars
Acquisitions of oil and gas properties
negative 314,161,000 US dollars
Additions to unproved properties
negative 33,732,000 US dollars
Drilling and completion costs
negative 311,888,000 US dollars
Additions to other property and equipment
negative 14,827,000 US dollars
Proceeds from asset sales
negative 1,844,000 US dollars
Change in other assets
negative 7,397,000 US dollars
Financing activities
108,648,000 US dollars. Net cash provided.
Issuances and borrowings of debt
5,401,943,000 US dollars
Repayments of debt
negative 5,235,643,000 US dollars
Repurchases of common stock
negative 55,699,000 US dollars
Payment of debt issuance costs
negative 1,453,000 US dollars
Distributions to noncontrolling interests in Martica Holdings LLC
0 US dollars
Employee tax withholding for settlement of equity-based compensation awards
negative 99,000 US dollars
Other
negative 401,000 US dollars
Operating adjustment reconciliation
571,817,000 US dollars. Intermediate calculation joining the operating reconciliation branches. Its gross amount includes any portion of net income routed through this junction. It is not an additional cash source or use.
financing gross reconciliation
5,401,943,000 US dollars. Gross amount at the activity's junction before offsetting its receipts and deductions. It is not an additional cash source or use.
investing gross reconciliation
683,849,000 US dollars. Gross amount at the activity's junction before offsetting its receipts and deductions. It is not an additional cash source or use.
Exchange-rate effect
0 US dollars
Ending cash on Sep 30, 2026
0 US dollars. Ending cash: Cash, cash equivalents, and restricted cash
Cash sources and uses
683,849,000 US dollars. Opening cash plus net sources, equal to net uses plus ending cash.
Net cash change
0 US dollars. Ending cash minus beginning cash.
Cash flow / Net income
1.57×. Operating cash flow divided by reconciliation net income for the same period. Black from 0.90× through 1.10×; green above 1.10×; red below 0.90×. Color uses the unrounded ratio.

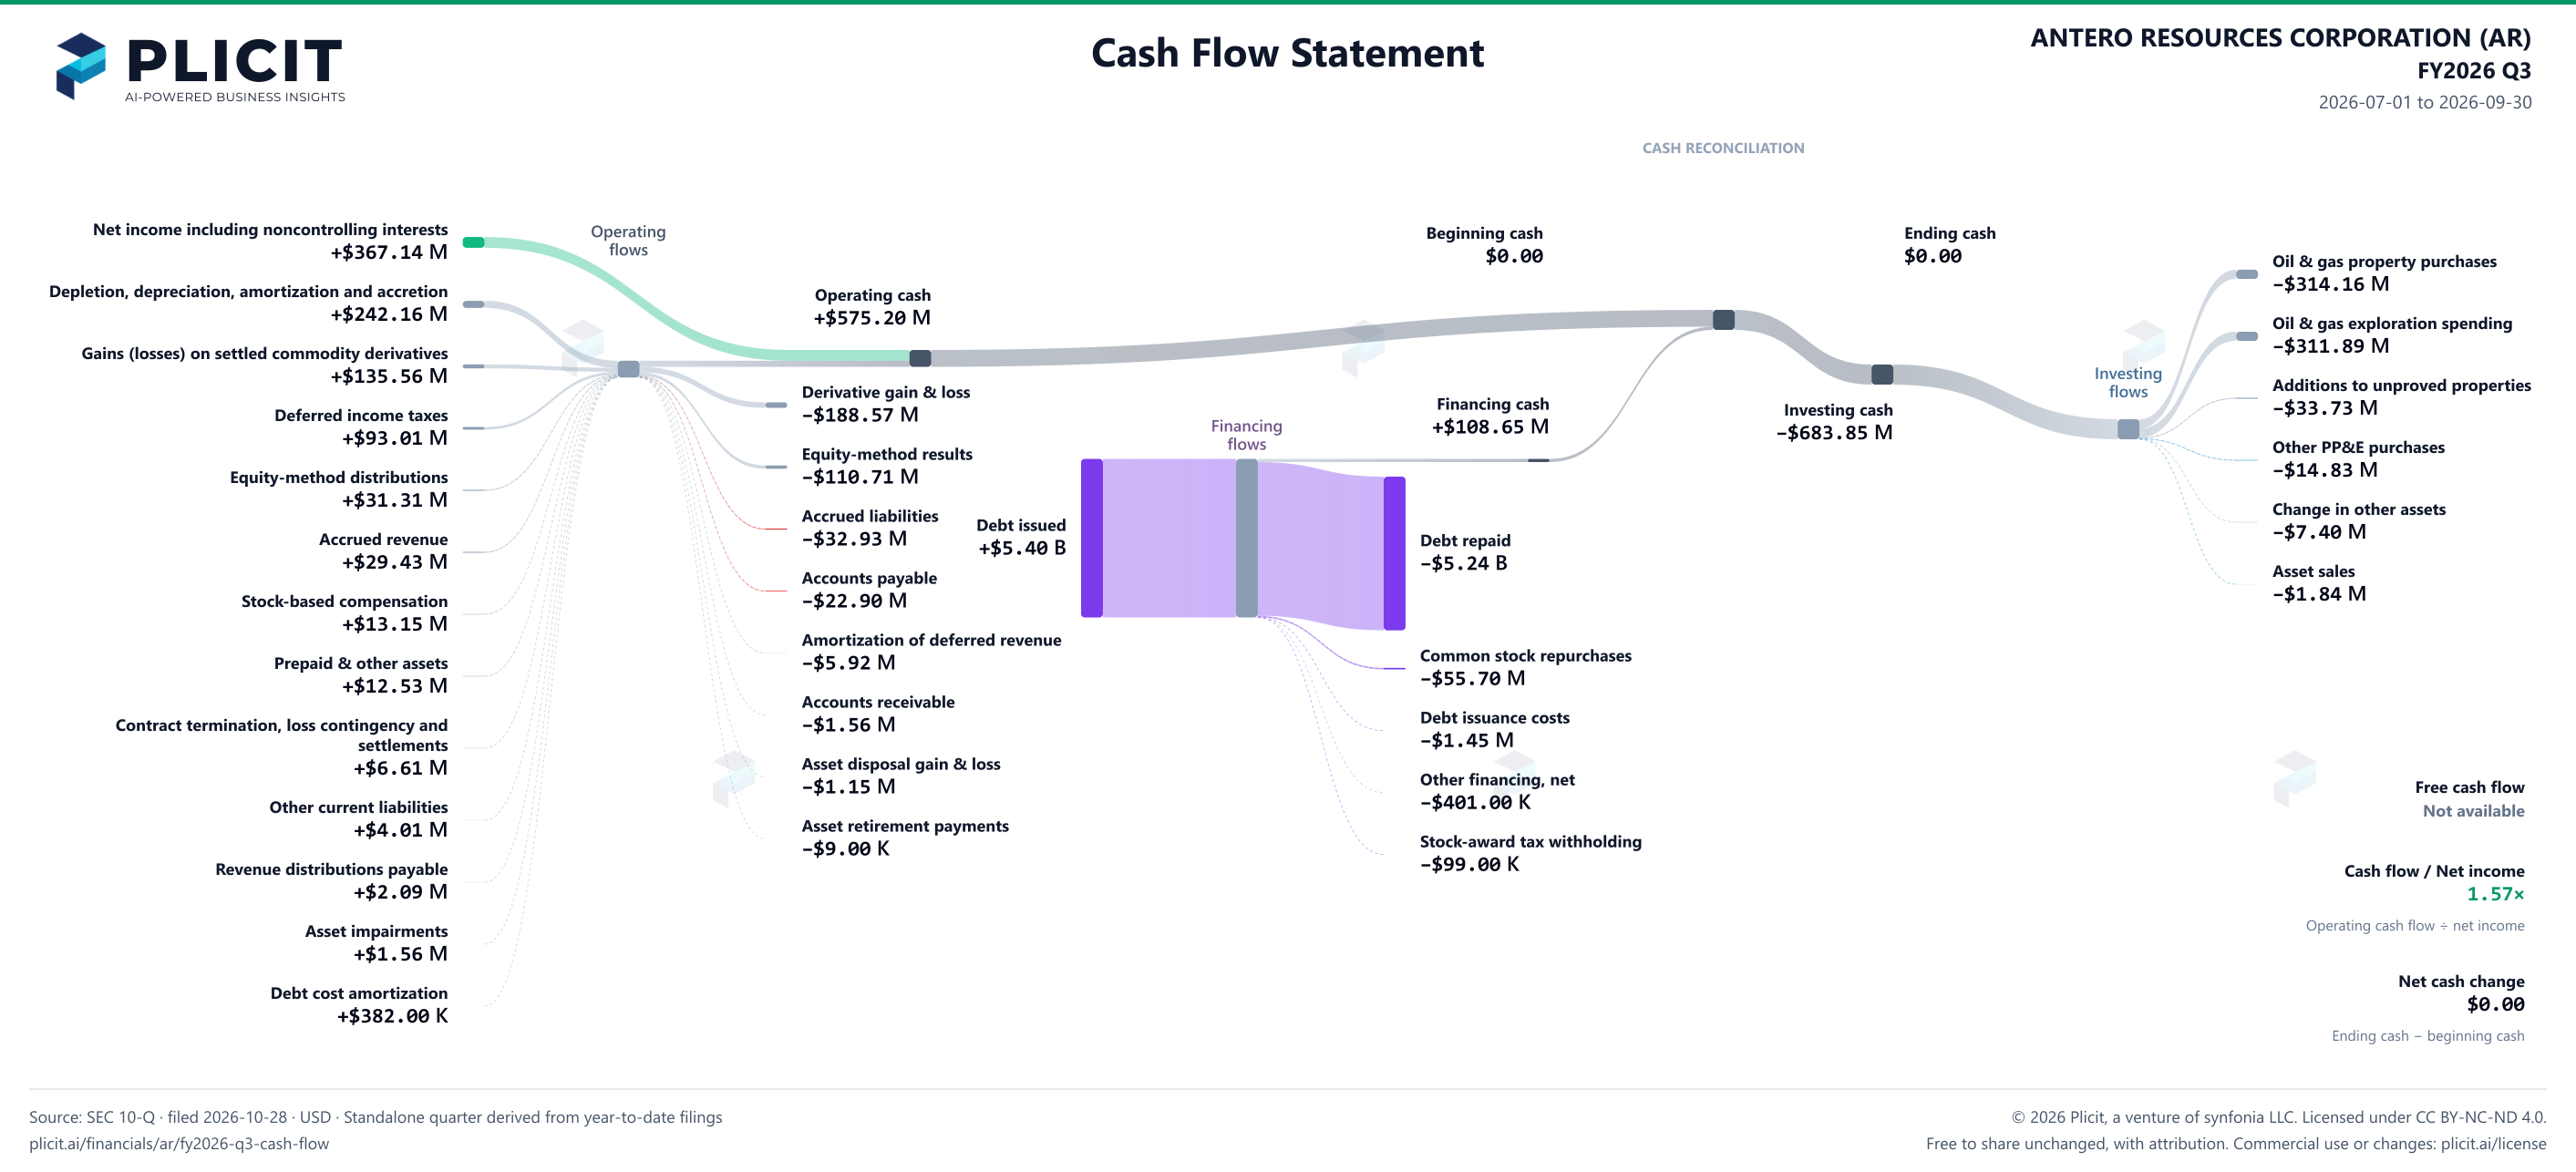
Chart connections

  • Beginning cash plus operating, investing and financing cash flows plus the exchange-rate effect equals ending cash. Negative amounts reduce cash.
  • Financing contributions meet at a reconciliation junction before connecting to the net cash total.
  • Investing contributions meet at a reconciliation junction before connecting to the net cash total.
  • Operating reconciliation adjustments are not all independent cash receipts.
  • Net income enters operating cash directly in the reconciliation. The adjustment junction contributes the remaining $208.06M after reconciling the other positive and negative adjustments. These connections depict an accounting reconciliation, not traced cash receipts.
  • Each activity has one net cash bar connected to the shared cash pool. Positive activity totals enter the pool; negative activity totals leave the pool to fund that activity's net payments. The central pool does not assign a particular funding source to a particular payment.
  • The intermediate calculation bars include both sides of the displayed activity breakdowns; they are not additional cash flows.
ANTERO RESOURCES CORPORATION (AR) FY2026 Q3 Statement of Cash Flows Sankey chart
Free to share unchanged, with credit to Plicit.ai · CC BY-NC-ND 4.0Download PNG

Intelligent Insights for Investors

Why is Antero Resources' cash from operations different from its profit?

Operations brought in $208.06 M more than profit this quarter. The largest reason was depletion, depreciation and amortization, a non-cash charge that added $242.16 M back.

Is Antero Resources bringing in more cash from operations than a year ago?

It is: operating cash grew 85% this quarter, while profit rose 329%. Profit is what the accounts say the company earned; operating cash is what reached the bank.

Is Antero Resources spending more or less on property and equipment than a year ago?

More: it spent $314.16 M on property and equipment this quarter, up 30% from $241.16 M a year earlier.

Are Antero Resources' buybacks actually reducing its share count?

Yes. It spent $55.70 M buying back shares this quarter, and its average diluted share count fell 0.8% from a year earlier, to 308.63 million.

Intelligent Insights for Lenders

Is Antero Resources borrowing more or paying down debt?

Borrowing and repayment nearly cancelled out. It raised $5.40 B of new debt this quarter and repaid $5.24 B, a net $166.30 M.

Intelligent Insights for Employees

How much does Antero Resources pay its people in stock instead of cash?

Equity-based pay came to $13.15 M this quarter, equal to 0.8% of sales and 2.3% of its cash from operations. Because it is non-cash, it is added back in cash from operations.

Product waitlist

Health Check and Teardown for your own company

A health check uncovers insights of your private books, not a public ticker. Join this list to get notified as soon as we go-live!