
Atmos Energy Corp (ATO) FY2026 Q3 Statement of Cash Flows

Published · Updated Source: Form 10-Q on SEC EDGAR filed (opens in a new tab)

Key Takeaways

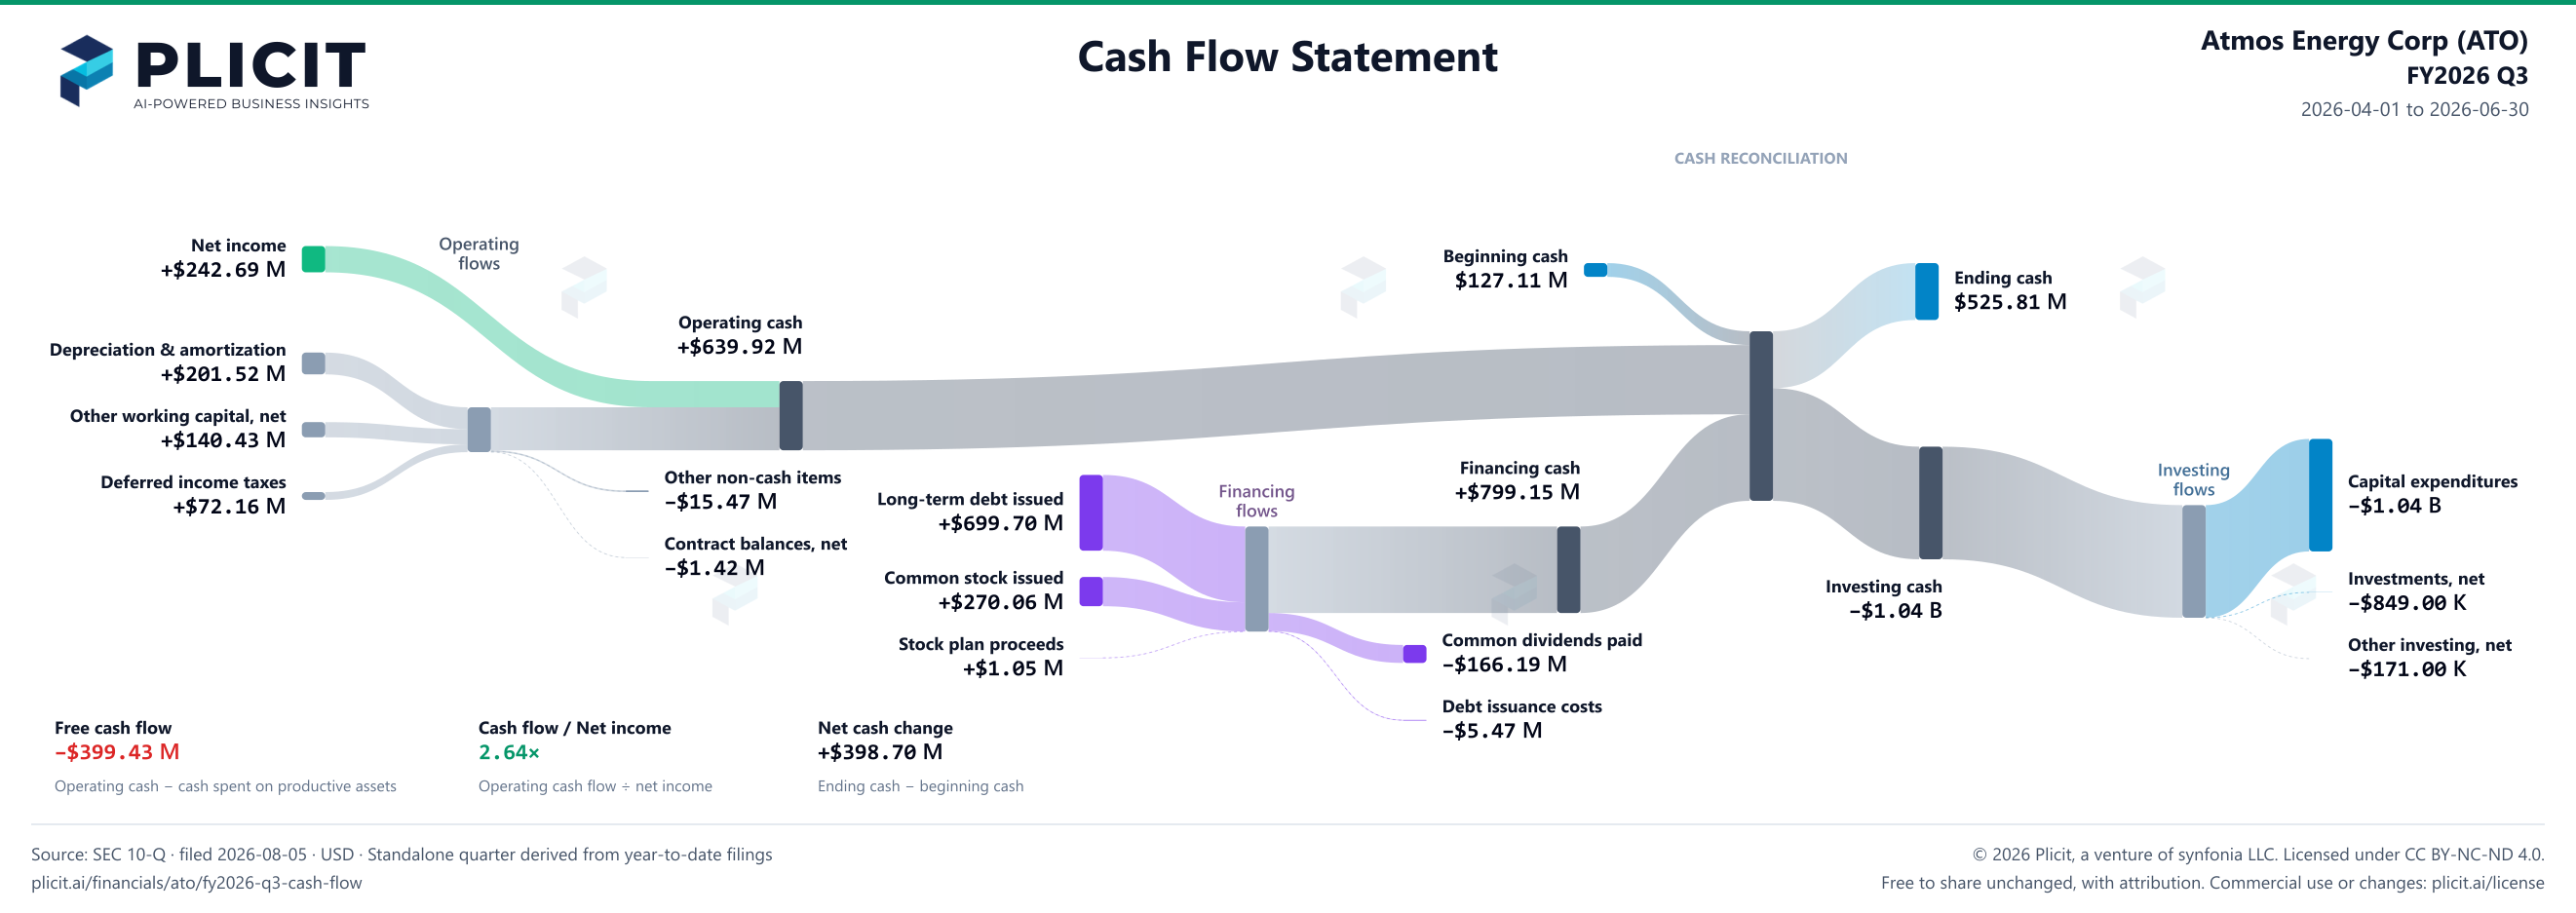
  • Capital spending of $1.04 B outran operating cash of $639.92 M by $399.43 M.
  • Dividends of $166.19 M were paid on top of that gap, not out of spare cash.
  • Borrowing made up the difference: $699.70 M of net new debt in the same quarter.
  • At this quarter's pace, $520.95 M of cash on hand lasts about four months.

The Unvarnished Truth

Atmos Energy's capital spending outran operating cash by $399.43 M

Atmos Energy's operating cash rose 29% to $639.92 M this quarter, and the headline looks healthy. Profit was $242.69 M, and depreciation and amortization cut that profit by $201.52 M without any cash leaving. That bookkeeping is why operating cash beat profit, and it is the first thing to test. Spending on property and equipment reached $1.04 B, past all of that operating cash, leaving a $399.43 M shortfall. That spending is up 20% on a year earlier, and the company credits system modernization.

Why was the gap paid for? Dividends of $166.19 M came out of the same cash, and borrowing covered the rest. Net borrowing was $699.70 M this quarter, against $498.08 M a year earlier. Borrowing has funded the gap in both periods, so it is a pattern rather than a one-off. The company declared $1.00 a share this quarter, up 15% from $0.87 a year earlier, so the payout grew too. Management says most of the capital is for safety and reliability, and it reports over 85 percent of spending that way.

For a reader, the cash line says the business is generating cash, while the spending line says it is outrunning what it earns. Operating cash of $639.92 M covers 62% of the $1.04 B spent on property and equipment. Cash and restricted cash rose from $127.11 M to $525.81 M over the quarter, and borrowing explains more than the whole climb. The filing does not say when the spending will start paying back in cash. Will operating cash catch up with the spending, or will the gap keep being filled with new borrowing?
2026-04-01 to 2026-06-30

Statement of Cash Flows

Swipe to see the full flow
Atmos Energy Corp cash flow reconciliation, Apr 1, 2026 through Jun 30, 2026One connected Sankey reconciles operating, investing and financing net cash flows through a shared cash pool, from beginning cash to ending cash. Ribbons flow left to right on one dollar scale. Activity totals are dark gray; beginning and ending cash are blue. Cash basis for beginning and ending balances and net cash change: Cash, cash equivalents, and restricted cash. Intermediate calculation bars are lighter gray. Net income is green for profit and red for loss. Identified asset purchases, sales and maturities are blue in either cash direction. Purple identifies capital transactions such as borrowing, repayments, share issuance and dividends. Free cash flow is a separate comparison, not an added cash flow. Read chart description and values below for full signed amounts, including zero items.Net income → Net cash from operating activities: $242,689,000.00Depreciation and amortization expense → Operating adjustments reconciliation: $201,521,000.00Net change in other operating assets and liabilities → Operating adjustments reconciliation: $140,432,000.00Deferred income taxes → Operating adjustments reconciliation: $72,162,000.00Operating adjustments reconciliation → Net cash from operating activities: $397,230,000.00Operating adjustments reconciliation → Other: $15,465,000.00Operating adjustments reconciliation → Net assets / liabilities from risk management activities: $1,420,000.00Proceeds from issuance of long-term debt → financing reconciliation: $699,699,000.00Net proceeds from equity issuances → financing reconciliation: $270,061,000.00Issuance of common stock through stock purchase and employee retirement plans → financing reconciliation: $1,045,000.00financing reconciliation → Net cash from financing activities: $799,148,000.00financing reconciliation → Cash dividends paid: $166,188,000.00financing reconciliation → Debt issuance costs: $5,469,000.00Net cash used in investing activities → investing reconciliation: $1,040,366,000.00investing reconciliation → Capital expenditures: $1,039,346,000.00investing reconciliation → Debt and equity securities activities, net: $849,000.00investing reconciliation → Other, net: $171,000.00Beginning cash: Cash, cash equivalents, and restricted cash → Cash sources and uses: $127,108,000.00Net cash from operating activities → Cash sources and uses: $639,919,000.00Net cash from financing activities → Cash sources and uses: $799,148,000.00Cash sources and uses → Ending cash: Cash, cash equivalents, and restricted cash: $525,809,000.00Cash sources and uses → Net cash used in investing activities: $1,040,366,000.00Depreciation and amortization expense: $201,521,000.00Depreciation & amortization+$201.52 MNet assets / liabilities from risk management activities: -$1,420,000.00Contract balances, net−$1.42 MNet income: $242,689,000.00Net income+$242.69 MOther: -$15,465,000.00Other non-cash items−$15.47 MNet change in other operating assets and liabilities: $140,432,000.00Other working capital, net+$140.43 MDeferred income taxes: $72,162,000.00Deferred income taxes+$72.16 MNet cash from operating activities: $639,919,000.00Operating cash+$639.92 MOperating adjustments reconciliation: $414,115,000.00Net proceeds from equity issuances: $270,061,000.00Common stock issued+$270.06 MIssuance of common stock through stock purchase and employee retirement plans: $1,045,000.00Stock plan proceeds+$1.05 MProceeds from issuance of long-term debt: $699,699,000.00Long-term debt issued+$699.70 MRepayment of long-term debt: $0.00Repayment of securitized long-term debt by AEK: $0.00Cash dividends paid: -$166,188,000.00Common dividends paid−$166.19 MDebt issuance costs: -$5,469,000.00Debt issuance costs−$5.47 MNet cash from financing activities: $799,148,000.00Financing cash+$799.15 Mfinancing reconciliation: $970,805,000.00Capital expenditures: -$1,039,346,000.00Capital expenditures−$1.04 BDebt and equity securities activities, net: -$849,000.00Investments, net−$849.00 KOther, net: -$171,000.00Other investing, net−$171.00 KNet cash used in investing activities: -$1,040,366,000.00. Cash required to fund net payments.Investing cash−$1.04 Binvesting reconciliation: $1,040,366,000.00Cash sources and uses: $1,566,175,000.00Beginning cash: Cash, cash equivalents, and restricted cash: $127,108,000.00Beginning cash$127.11 MEnding cash: Cash, cash equivalents, and restricted cash: $525,809,000.00Ending cash$525.81 MCASH RECONCILIATIONOperatingflowsFinancingflowsInvestingflowsFree cash flow−$399.43 MOperating cash − cash spent on productive assetsCash flow / Net income2.64×Operating cash flow ÷ net incomeNet cash change+$398.70 MEnding cash − beginning cash
Chart details

Atmos Energy Corp cash flow reconciliation, Apr 1, 2026 through Jun 30, 2026

Cash flows for Apr 1, 2026 through Jun 30, 2026. Cash basis: Cash, cash equivalents, and restricted cash. Beginning cash: Mar 31, 2026. Ending cash: Jun 30, 2026. Beginning and ending cash are dated balances. Positive cash flows add cash; negative cash flows reduce it.

Beginning cash on Mar 31, 2026
127,108,000 US dollars. Beginning cash: Cash, cash equivalents, and restricted cash
Operating activities
639,919,000 US dollars. Net cash provided.
Net income
242,689,000 US dollars
Depreciation and amortization expense
201,521,000 US dollars
Net assets / liabilities from risk management activities
negative 1,420,000 US dollars
Other
negative 15,465,000 US dollars
Net change in other operating assets and liabilities
140,432,000 US dollars
Deferred income taxes
72,162,000 US dollars
Investing activities
negative 1,040,366,000 US dollars. Net cash used.
Capital expenditures
negative 1,039,346,000 US dollars
Debt and equity securities activities, net
negative 849,000 US dollars
Other, net
negative 171,000 US dollars
Financing activities
799,148,000 US dollars. Net cash provided.
Net proceeds from equity issuances
270,061,000 US dollars
Issuance of common stock through stock purchase and employee retirement plans
1,045,000 US dollars
Proceeds from issuance of long-term debt
699,699,000 US dollars
Repayment of long-term debt
0 US dollars
Repayment of securitized long-term debt by AEK
0 US dollars
Cash dividends paid
negative 166,188,000 US dollars
Debt issuance costs
negative 5,469,000 US dollars
Operating adjustment reconciliation
414,115,000 US dollars. Intermediate calculation joining the operating reconciliation branches. Its gross amount includes any portion of net income routed through this junction. It is not an additional cash source or use.
financing gross reconciliation
970,805,000 US dollars. Gross amount at the activity's junction before offsetting its receipts and deductions. It is not an additional cash source or use.
investing gross reconciliation
1,040,366,000 US dollars. Gross amount at the activity's junction before offsetting its receipts and deductions. It is not an additional cash source or use.
Exchange-rate effect
0 US dollars
Ending cash on Jun 30, 2026
525,809,000 US dollars. Ending cash: Cash, cash equivalents, and restricted cash
Cash sources and uses
1,566,175,000 US dollars. Opening cash plus net sources, equal to net uses plus ending cash.
Net cash change
398,701,000 US dollars. Ending cash minus beginning cash.
Cash flow / Net income
2.64×. Operating cash flow divided by reconciliation net income for the same period. Black from 0.90× through 1.10×; green above 1.10×; red below 0.90×. Color uses the unrounded ratio.
Operating cash flow
639,919,000 US dollars. Operating cash flow used in the free cash flow calculation.
cash spent on productive assets
1,039,346,000 US dollars. These cash purchases are already included in investing activities above.
Free cash flow
negative 399,427,000 US dollars. A supplemental measure; finance-lease payments are excluded from this definition.

Chart connections

  • Beginning cash plus operating, investing and financing cash flows plus the exchange-rate effect equals ending cash. Negative amounts reduce cash.
  • Financing contributions meet at a reconciliation junction before connecting to the net cash total.
  • Investing contributions meet at a reconciliation junction before connecting to the net cash total.
  • Operating reconciliation adjustments are not all independent cash receipts.
  • Net income enters operating cash directly in the reconciliation. The adjustment junction contributes the remaining $397.23M after reconciling the other positive and negative adjustments. These connections depict an accounting reconciliation, not traced cash receipts.
  • Each activity has one net cash bar connected to the shared cash pool. Positive activity totals enter the pool; negative activity totals leave the pool to fund that activity's net payments. The central pool does not assign a particular funding source to a particular payment.
  • The intermediate calculation bars include both sides of the displayed activity breakdowns; they are not additional cash flows.
  • Operating cash flow minus cash spent on productive assets equals free cash flow: 639,919,000 US dollars minus 1,039,346,000 US dollars equals negative 399,427,000 US dollars.
Atmos Energy Corp (ATO) FY2026 Q3 Statement of Cash Flows Sankey chart
Free to share unchanged, with credit to Plicit.ai · CC BY-NC-ND 4.0Download PNG

Intelligent Insights for Investors

Is Atmos Energy bringing in more cash from operations than a year ago?

Yes: operations brought in $639.92 M this quarter, up 29% on a year earlier. Profit rose over the same span, from $186.43 M to $242.69 M, and comparing the two shows whether earnings are turning into money in the bank.

Is Atmos Energy spending more or less on property and equipment than a year ago?

More: Atmos Energy spent $1.04 B on property and equipment this quarter, up 20% from $866.93 M a year earlier. Each extra dollar of that spending must be paid for from operations, borrowing or new shares, and the operations line covers only part of it.

Did Atmos Energy's cash after capital spending cover its dividends and buybacks?

No. Before any payouts, investment had already used $399.43 M more cash than the business brought in this quarter. The dividends, $166.19 M, came on top of that.

Did Atmos Energy raise or cut its dividend?

Raised: Atmos Energy declared $1.00 a share this quarter, up 15% from $0.87 a year earlier. Raising the payout while spending outruns cash makes the dividend a claim on borrowing.

Intelligent Insights for Lenders

Is Atmos Energy borrowing more or paying down debt?

Borrowing, on balance: it took on a net $699.70 M of debt this quarter, against a net $498.08 M a year earlier. That debt must be repaid with interest, so each dollar borrowed becomes a future cash cost.

Intelligent Insights for Suppliers

How long can Atmos Energy's cash last at its current spending?

At this quarter's pace, the $520.95 M of cash on June 30, 2026 would last about 4 months. That is an illustration at a past pace, not a forecast, and it leaves out debt coming due.

Product waitlist

Health Check and Teardown for your own company

A health check uncovers insights of your private books, not a public ticker. Join this list to get notified as soon as we go-live!