
Axogen, Inc. (AXGN) FY2026 Q3 Balance Sheet

Published Source: Form 10-Q on SEC EDGAR filed (opens in a new tab)

As of 2026-09-30

Balance Sheet

Swipe to see the full flow
Axogen, Inc. (AXGN) FY2026 Q3 Balance SheetBalance sheet as of 2026-09-30. The chart shows assets, liabilities and equity at that date.Current liabilities$36.46 MLiabilities$54.24 MCurrent assets$438.09 MNon-current liabilities$17.78 MAssets$550.34 MEquity$496.10 MNon-current assets$112.25 MHOLDINGSASSET CLASSASSETSCLAIM CLASSCLAIM SUB-CLASSCLAIMSCash and cash equivalentsInventoryAccounts receivable, net of allowance for doubtful accounts of $770 and $948, respectivelyInvestmentsPrepaid expenses and other assetsRestricted cashProperty and equipment, netOperating lease right-of-use assetsOther assets, netIntangible assets, netAccounts payable and accrued expensesCurrent maturities of long-term lease obligationsLong-term lease obligationsOther long-term liabilitiesAdditional paid-in capitalCommon stock, $0.01 par value per share; 100,000,000 shares authorized; 59,724,524 and 47,199,797 shares issued and outstanding, respectivelyAccumulated deficitCurrent assetsNon-current assetsAssetsCurrent liabilitiesNon-current liabilitiesLiabilitiesEquityEquityCurrent liabilitiesCurrent liabilities$36.46 MCash and cash equivalentsCash and cash equivalents$328.89 MAccounts payable and accrued expensesAccounts payable and accrued expenses$34.63 MLiabilitiesLiabilities$54.24 MCurrent maturities of long-term lease obligationsCurrent maturities of long-term lease obligations$1.83 MCurrent assetsCurrent assets$438.09 MInventoryInventory$49.06 MNon-current liabilitiesNon-current liabilities$17.78 MLong-term lease obligationsLong-term lease obligations$17.64 MAccounts receivable, net of allowance for doubtful accounts of $770 and $948, respectivelyAccounts receivable, net$34.01 MOther long-term liabilitiesOther long-term liabilities$141.00 KAssetsAssets$550.34 MInvestmentsInvestments$19.18 MEquityEquity$496.10 MPrepaid expenses and other assetsPrepaid expenses and other assets$4.95 MRestricted cashRestricted cash$2.00 MAdditional paid-in capitalAdditional paid-in capital$821.24 MProperty and equipment, netProperty and equipment, net$81.95 MNon-current assetsNon-current assets$112.25 MCommon stock, $0.01 par value per share; 100,000,000 shares authorized; 59,724,524 and 47,199,797 shares issued and outstanding, respectivelyCommon stock$597.00 KOperating lease right-of-use assetsOperating lease right-of-use assets$13.39 MOther assets, netOther assets, net$9.00 MAccumulated deficitAccumulated deficit−$325.73 MIntangible assets, netIntangible assets, net$7.91 M
Chart details

Axogen, Inc. (AXGN) FY2026 Q3 Balance Sheet

Balance sheet as of 2026-09-30. The chart shows assets, liabilities and equity at that date.

Assets
550,339,000 US dollars
Current assets
438,092,000 US dollars
Non-current assets
112,247,000 US dollars
Liabilities
54,236,000 US dollars
Current liabilities
36,456,000 US dollars
Non-current liabilities
17,780,000 US dollars
Equity
496,103,000 US dollars
Cash and cash equivalents
328,888,000 US dollars
Inventory
49,063,000 US dollars
Accounts receivable, net of allowance for doubtful accounts of $770 and $948, respectively
34,008,000 US dollars
Investments
19,180,000 US dollars
Prepaid expenses and other assets
4,953,000 US dollars
Restricted cash
2,000,000 US dollars
Property and equipment, net
81,946,000 US dollars
Operating lease right-of-use assets
13,394,000 US dollars
Other assets, net
8,997,000 US dollars
Intangible assets, net
7,910,000 US dollars
Accounts payable and accrued expenses
34,626,000 US dollars
Current maturities of long-term lease obligations
1,830,000 US dollars
Long-term lease obligations
17,639,000 US dollars
Other long-term liabilities
141,000 US dollars
Long-term debt, net of debt discount and financing fees
0 US dollars
Debt derivative liabilities
0 US dollars
Additional paid-in capital
821,235,000 US dollars
Common stock, $0.01 par value per share; 100,000,000 shares authorized; 59,724,524 and 47,199,797 shares issued and outstanding, respectively
597,000 US dollars
Accumulated deficit
negative 325,729,000 US dollars

Chart connections

  • Assets equal liabilities plus consolidated equity. Consolidated equity includes noncontrolling interests when reported.
  • Treasury shares and other negative equity contributions reduce equity.
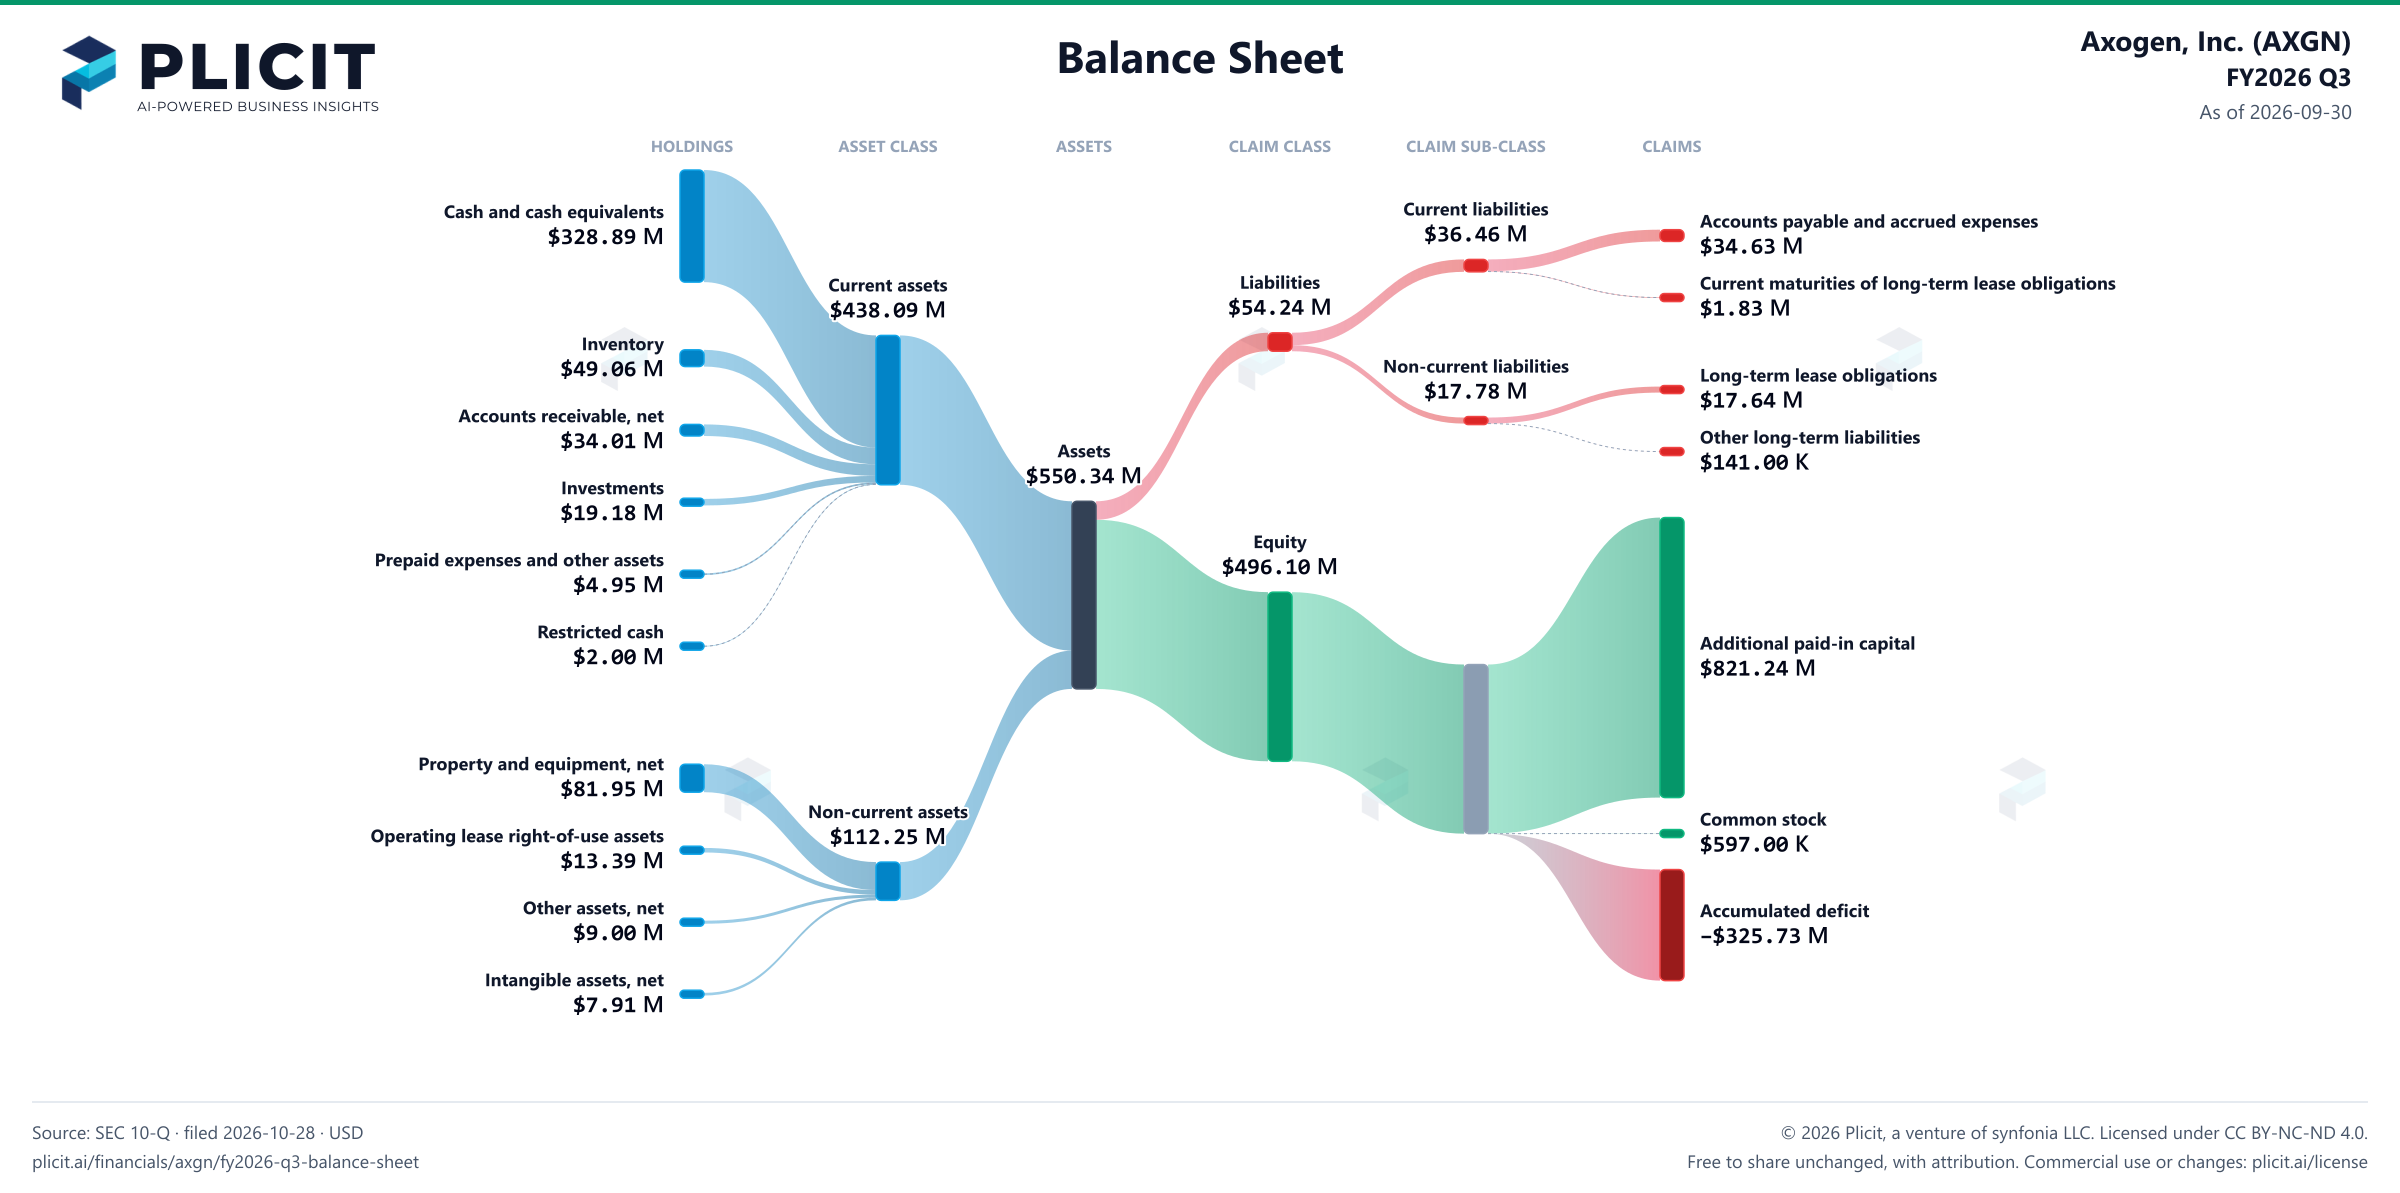
Axogen, Inc. (AXGN) FY2026 Q3 Balance Sheet Sankey chart
Free to share unchanged, with credit to Plicit.ai · CC BY-NC-ND 4.0Download PNG

Product waitlist

Health Check and Teardown for your own company

A health check uncovers insights of your private books, not a public ticker. Join this list to get notified as soon as we go-live!