
ACUITY INC. (AYI) FY2026 Q2 Balance Sheet
Published Source: Form 10-Q on SEC EDGAR filed (opens in a new tab)
Balance Sheet
Swipe to see the full flow
Chart details
ACUITY INC. (AYI) FY2026 Q2 Balance Sheet
Balance sheet as of 2026-02-28. The chart shows assets, liabilities and equity at that date.
- Assets
- 4,558,500,000 US dollars
- Current assets
- 1,505,200,000 US dollars
- Non-current assets
- 3,053,300,000 US dollars
- Liabilities
- 1,717,700,000 US dollars
- Current liabilities
- 728,100,000 US dollars
- Non-current liabilities
- 989,600,000 US dollars
- Equity
- 2,840,800,000 US dollars
- Accounts receivable, less reserve for doubtful accounts of $6.3 and $4.3, respectively
- 579,000,000 US dollars
- Inventories
- 515,200,000 US dollars
- Cash and cash equivalents
- 272,500,000 US dollars
- Prepayments and other current assets
- 138,500,000 US dollars
- Goodwill
- 1,497,400,000 US dollars
- Intangible assets, net
- 1,056,400,000 US dollars
- Property, plant, and equipment, net
- 350,300,000 US dollars
- Operating lease right-of-use assets
- 101,900,000 US dollars
- Other long-term assets
- 44,100,000 US dollars
- Deferred income taxes
- 3,200,000 US dollars
- Accounts payable
- 354,600,000 US dollars
- Other current liabilities
- 241,000,000 US dollars
- Accrued compensation
- 106,200,000 US dollars
- Current operating lease liabilities
- 26,300,000 US dollars
- Long-term debt
- 697,100,000 US dollars
- Other long-term liabilities
- 140,600,000 US dollars
- Long-term operating lease liabilities
- 84,800,000 US dollars
- Accrued pension liabilities
- 39,900,000 US dollars
- Deferred income taxes
- 27,200,000 US dollars
- Retained earnings
- 4,491,500,000 US dollars
- Paid-in capital
- 1,164,500,000 US dollars
- Common stock, $0.01 par value per share; 500.0 shares authorized; 55.0 and 54.9 shares issued, respectively
- 600,000 US dollars
- Preferred stock, $0.01 par value per share; 50.0 shares authorized; none issued
- 0 US dollars
- Treasury stock, at cost, of 24.5 and 24.2 shares, respectively
- negative 2,755,100,000 US dollars
- Accumulated other comprehensive loss
- negative 60,700,000 US dollars
Chart connections
- Assets equal liabilities plus consolidated equity. Consolidated equity includes noncontrolling interests when reported.
- Treasury shares and other negative equity contributions reduce equity.
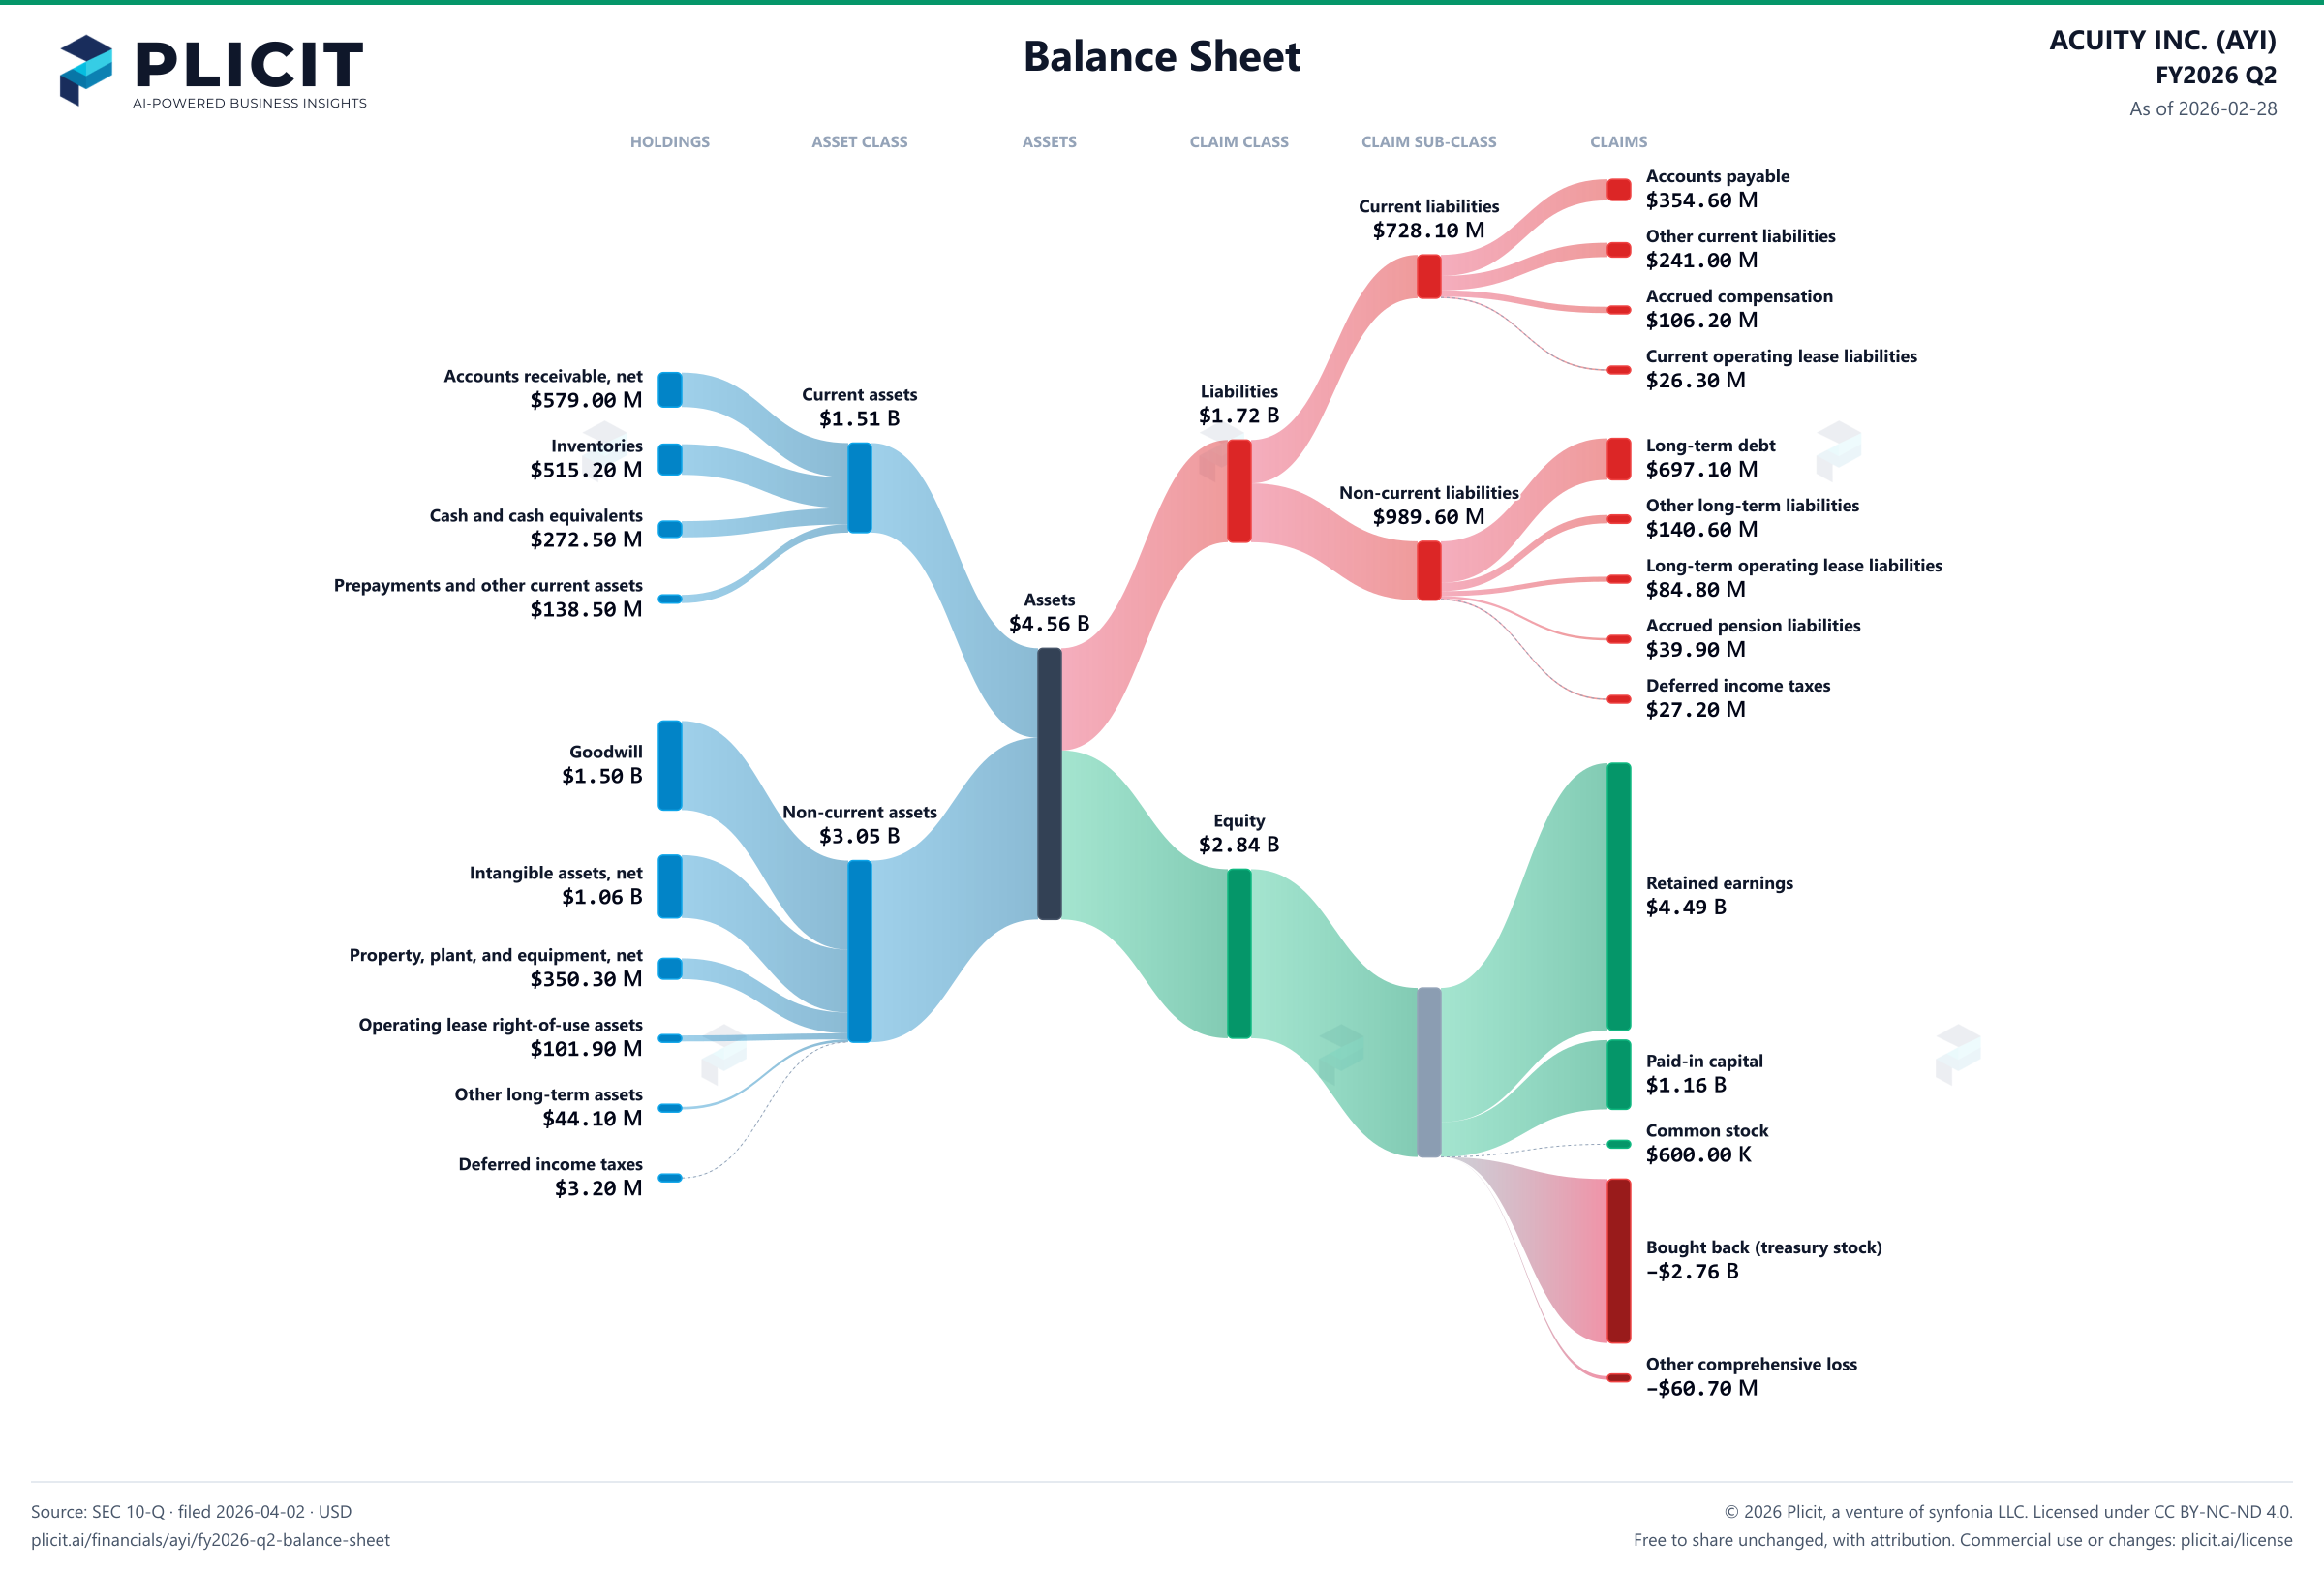
Free to share unchanged, with credit to Plicit.ai · CC BY-NC-ND 4.0Download PNG
Product waitlist
Health Check and Teardown for your own company
A health check uncovers insights of your private books, not a public ticker. Join this list to get notified as soon as we go-live!