
BELDEN INC. (BDC) FY2026 Q2 Balance Sheet

Balance Sheet

As of 2026-06-28

Swipe to see the full flow
BELDEN INC. (BDC) FY2026 Q2 Balance SheetBalance sheet as of 2026-06-28. The chart shows assets, liabilities and equity at that date.Current liabilities$652.79 MLiabilities(calculated)$2.18 BCurrent assets$1.39 BAssets$3.57 BNon-current liabilities$1.53 BNon-current assets$2.17 BEquity$1.38 BGross equity(calculated)$2.39 BHOLDINGSASSET CLASSASSETSCLAIM CLASSCLAIM SUB-CLASSCLAIMSReceivables, netInventories, netCash and cash equivalentsOther current assetsGoodwillProperty, plant and equipment, less accumulated depreciationIntangible assets, less accumulated amortizationOperating lease right-of-use assetsOther long-lived assetsDeferred income taxesAccounts payableAccrued liabilitiesLong-term debtDeferred income taxesLong-term operating lease liabilitiesPostretirement benefitsOther long-term liabilitiesRetained earningsAdditional paid-in capitalCommon stockCurrent assetsNon-current assetsAssetsCurrent liabilitiesNon-current liabilitiesLiabilities (calculated)EquityGross equity (calculated)Treasury stockAccumulated other comprehensive lossCurrent liabilitiesCurrent liabilities$652.79 MAccounts payableAccounts payable$359.19 MLiabilities (calculated)Liabilities(calculated)$2.18 BAccrued liabilitiesAccrued liabilities$293.60 MCurrent assetsCurrent assets$1.39 BReceivables, netReceivables, net$534.16 MInventories, netInventories, net$420.59 MAssetsAssets$3.57 BLong-term debtLong-term debt$1.23 BNon-current liabilitiesNon-current liabilities$1.53 BCash and cash equivalentsCash and cash equivalents$348.66 MDeferred income taxesDeferred income taxes$115.16 MOther current assetsOther current assets$90.44 MLong-term operating lease liabilitiesLong-term operating lease liabilities$88.66 MNon-current assetsNon-current assets$2.17 BGoodwillGoodwill$1.03 BEquityEquity$1.38 BPostretirement benefitsPostretirement benefits$61.94 MOther long-term liabilitiesOther long-term liabilities$33.69 MGross equity (calculated)Gross equity(calculated)$2.39 BProperty, plant and equipment, less accumulated depreciationProperty, plant and equipment, net$583.71 MIntangible assets, less accumulated amortizationIntangible assets, less accumulated amortization$380.94 MRetained earningsRetained earnings$1.52 BOperating lease right-of-use assetsOperating lease right-of-use assets$102.58 MOther long-lived assetsOther long-lived assets$62.90 MAdditional paid-in capitalAdditional paid-in capital$871.18 MDeferred income taxesDeferred income taxes$13.38 MCommon stockCommon stock$503.00 KTreasury stockTreasury stock−$937.16 MAccumulated other comprehensive lossAccumulated other comprehensive loss−$71.18 M
Chart details

BELDEN INC. (BDC) FY2026 Q2 Balance Sheet

Balance sheet as of 2026-06-28. The chart shows assets, liabilities and equity at that date.

Assets
3,567,356,000 US dollars
Current assets
1,393,841,000 US dollars
Non-current assets
2,173,515,000 US dollars
Liabilities (calculated)
2,182,802,000 US dollars
Current liabilities
652,786,000 US dollars
Non-current liabilities
1,530,016,000 US dollars
Equity
1,384,554,000 US dollars
Receivables, net
534,159,000 US dollars
Inventories, net
420,591,000 US dollars
Cash and cash equivalents
348,655,000 US dollars
Other current assets
90,436,000 US dollars
Goodwill
1,030,000,000 US dollars
Property, plant and equipment, less accumulated depreciation
583,710,000 US dollars
Intangible assets, less accumulated amortization
380,942,000 US dollars
Operating lease right-of-use assets
102,580,000 US dollars
Other long-lived assets
62,903,000 US dollars
Deferred income taxes
13,380,000 US dollars
Accounts payable
359,189,000 US dollars
Accrued liabilities
293,597,000 US dollars
Long-term debt
1,230,566,000 US dollars
Deferred income taxes
115,160,000 US dollars
Long-term operating lease liabilities
88,662,000 US dollars
Postretirement benefits
61,938,000 US dollars
Other long-term liabilities
33,690,000 US dollars
Retained earnings
1,521,208,000 US dollars
Additional paid-in capital
871,183,000 US dollars
Common stock
503,000 US dollars
Treasury stock
negative 937,156,000 US dollars
Accumulated other comprehensive loss
negative 71,184,000 US dollars
Gross equity (calculated)
2,392,894,000 US dollars. Net equity plus the magnitudes of its negative contributions equals gross positive equity. The negative contributions enter this reconciliation as add-backs; their filed signs stay negative.

Chart connections

  • Assets equal liabilities plus consolidated equity. Consolidated equity includes noncontrolling interests when reported.
  • Treasury shares and other negative equity contributions reduce equity.
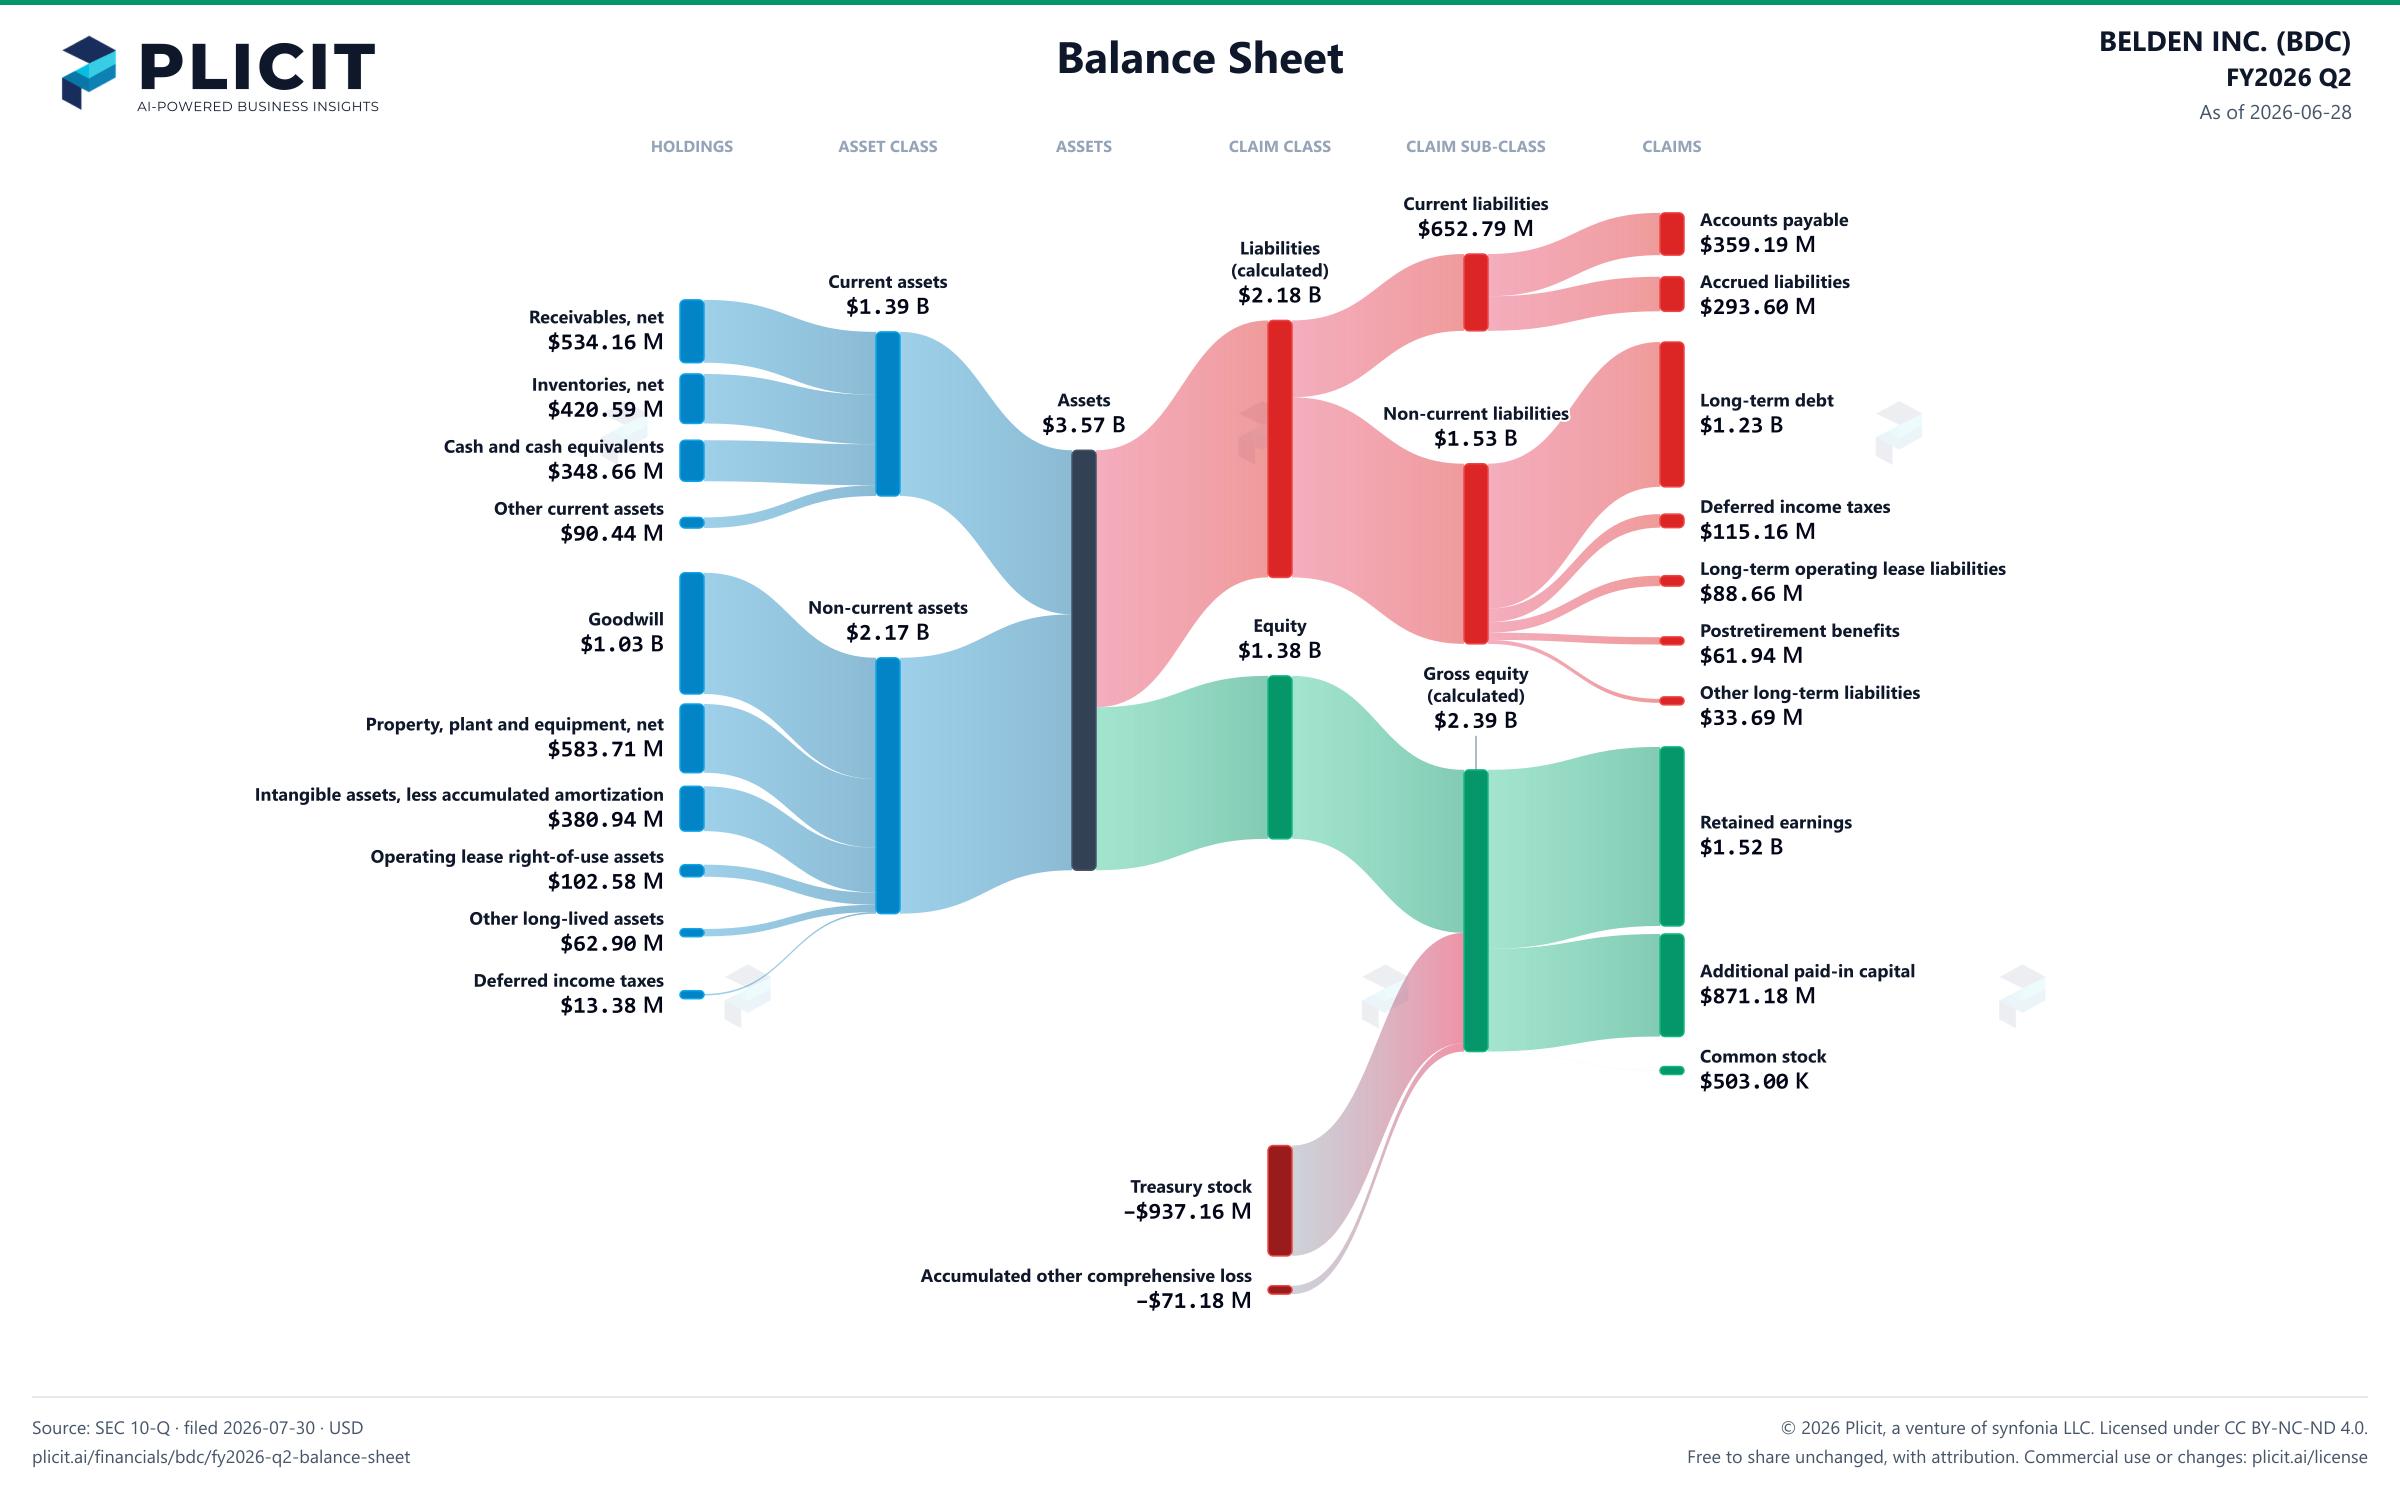
BELDEN INC. (BDC) FY2026 Q2 Balance Sheet Sankey chart
Free to share unchanged, with credit to Plicit.ai · CC BY-NC-ND 4.0Download PNG

Newsletter

Get the teardowns by email

Subscribe if you want the public-company teardowns in your inbox when they're released.

Product waitlist

Health Check and Teardown for your own company

A health check uncovers insights of your private books, not a public ticker. Join this list to get notified as soon as we go-live!