
Becton, Dickinson and Company (BDX) FY2025 Q1 Balance Sheet
As of 2024-12-31
Balance Sheet
As of 2024-12-31
Swipe to see the full flow
Chart details
Becton, Dickinson and Company (BDX) FY2025 Q1 Balance Sheet
Balance sheet as of 2024-12-31. The chart shows assets, liabilities and equity at that date.
- Assets
- 54,665,000,000 US dollars
- Current assets
- 8,659,000,000 US dollars
- Non-current assets
- 46,006,000,000 US dollars
- Liabilities (calculated)
- 29,460,000,000 US dollars
- Current liabilities
- 7,664,000,000 US dollars
- Non-current liabilities
- 21,796,000,000 US dollars
- Equity
- 25,205,000,000 US dollars
- Property, Plant and Equipment
- 14,156,000,000 US dollars. Part of Property, Plant and Equipment, Net, drawn as one net amount.
- Less allowances for depreciation and amortization
- negative 7,554,000,000 US dollars. Part of Property, Plant and Equipment, Net, drawn as one net amount.
- Trade receivables, net
- 2,638,000,000 US dollars
- Finished products
- 2,502,000,000 US dollars
- Prepaid expenses and other
- 1,331,000,000 US dollars
- Materials
- 904,000,000 US dollars
- Cash and equivalents
- 711,000,000 US dollars
- Work in process
- 453,000,000 US dollars
- Restricted cash
- 102,000,000 US dollars
- Short-term investments
- 17,000,000 US dollars
- Goodwill
- 26,329,000,000 US dollars
- Developed Technology, Net
- 7,439,000,000 US dollars
- Property, Plant and Equipment, Net
- 6,602,000,000 US dollars
- Other Assets
- 2,586,000,000 US dollars
- Customer Relationships, Net
- 2,533,000,000 US dollars
- Other Intangibles, Net
- 517,000,000 US dollars
- Payables, accrued expenses and other current liabilities
- 6,347,000,000 US dollars
- Current debt obligations
- 1,318,000,000 US dollars
- Long-Term Debt
- 17,440,000,000 US dollars
- Deferred Income Taxes and Other Liabilities
- 3,418,000,000 US dollars
- Long-Term Employee Benefit Obligations
- 939,000,000 US dollars
- Capital in excess of par value
- 19,768,000,000 US dollars
- Retained earnings
- 16,141,000,000 US dollars
- Common stock — $1 par value; authorized — 640,000,000 shares; issued — 370,594,401 shares in December 31, 2024 and September 30, 2024
- 371,000,000 US dollars
- Deferred compensation
- 25,000,000 US dollars
- Treasury stock
- negative 9,425,000,000 US dollars
- Accumulated other comprehensive loss
- negative 1,676,000,000 US dollars
Chart connections
- Assets equal liabilities plus consolidated equity. Consolidated equity includes noncontrolling interests when reported.
- Treasury shares and other negative equity contributions reduce equity.
- The filed current assets lines add up to $8,658.00 M and the current assets total is $8,659.00 M; the $1.00 M difference is within the rounding of the filed amounts.
- The filed current liabilities lines add up to $7,665.00 M and the current liabilities total is $7,664.00 M; the $1.00 M difference is within the rounding of the filed amounts.
- The filed non-current liabilities lines add up to $21,797.00 M and the non-current liabilities total is $21,796.00 M; the $1.00 M difference is within the rounding of the filed amounts.
- The filed equity lines add up to $25,204.00 M and the equity total is $25,205.00 M; the $1.00 M difference is within the rounding of the filed amounts.
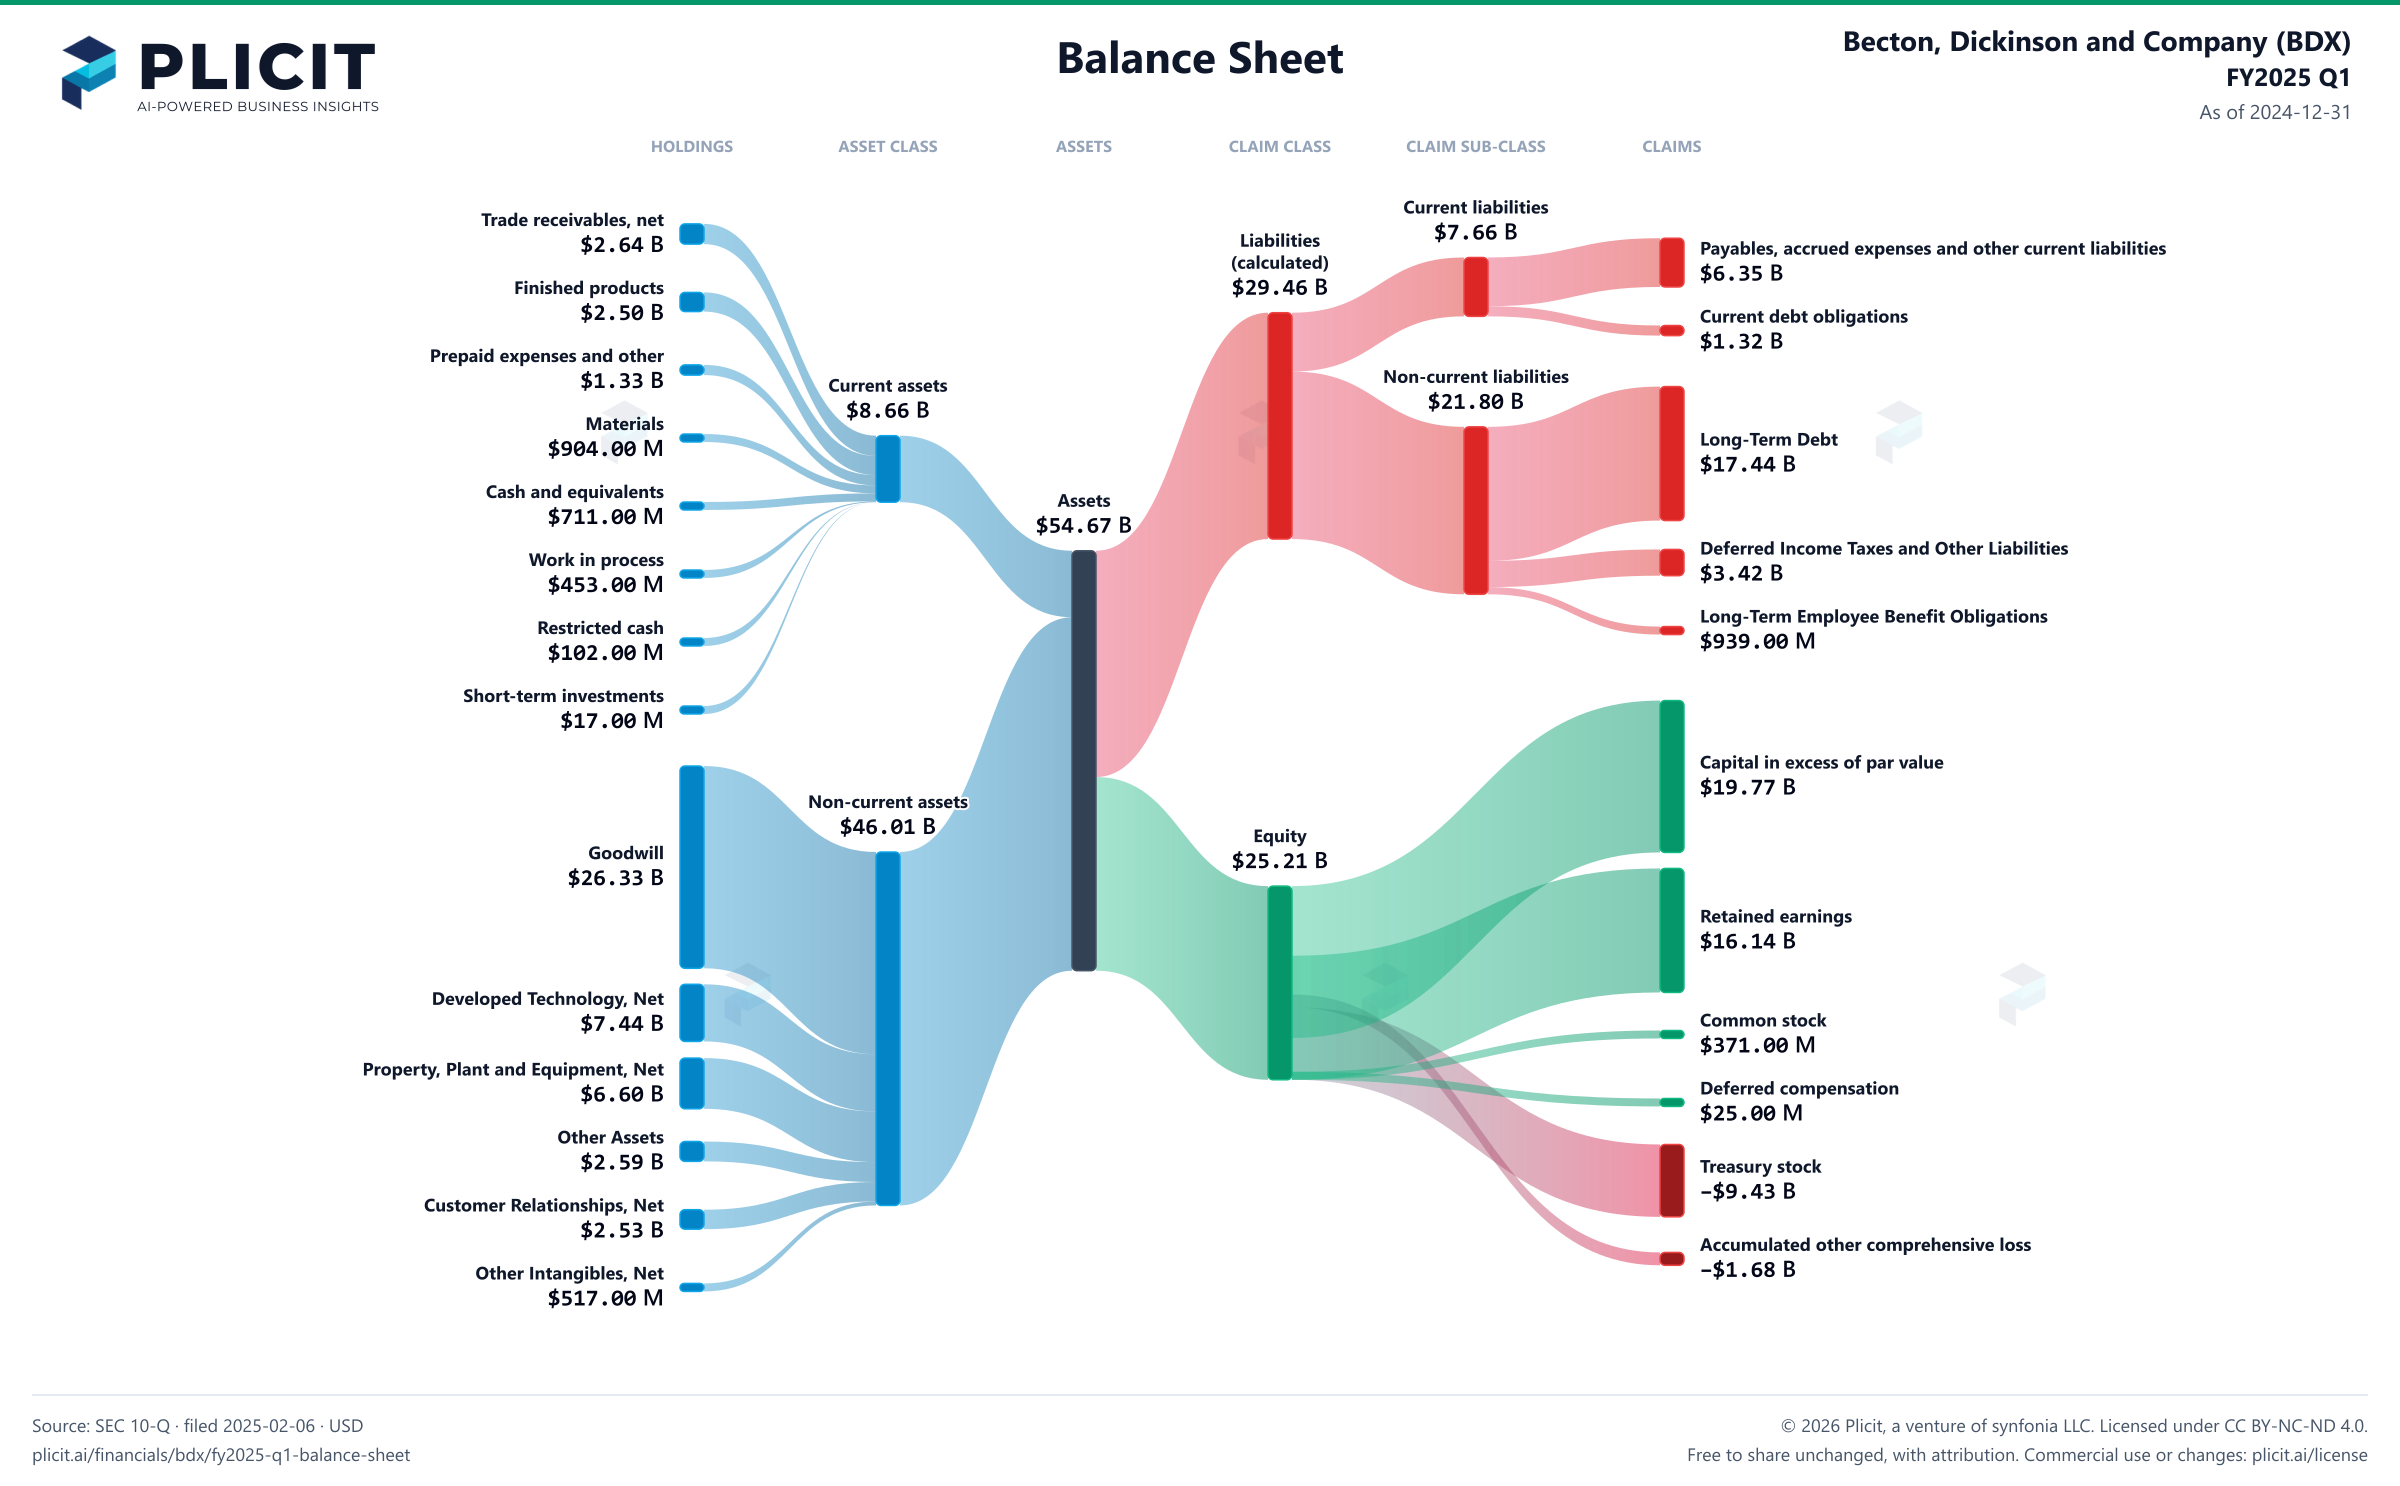
Free to share unchanged, with credit to Plicit.ai · CC BY-NC-ND 4.0Download PNG
Product waitlist
Health Check and Teardown for your own company
A health check uncovers insights of your private books, not a public ticker. Join this list to get notified as soon as we go-live!