
BIGLARI HOLDINGS INC. (BH-A) FY2026 YTD Q2 P&L / Income Statement

Revenue by Business Segment by Product and Service

2026-01-01 to 2026-06-30

Swipe to see the full flow
BIGLARI HOLDINGS INC. (BH-A) FY2026 YTD Q2 P&L / Income StatementIncome statement for 2026-01-01 through 2026-06-30. View: Segments by Product and Service. Revenue uses this breakdown; costs and expenses retain the consolidated categories.SOURCESREVENUEGROSSOPERATINGPRE-TAXNETRestaurant operations - Net salesRestaurant operations - Franchise partner feesInsurance SegmentOil And Gas SegmentBrand LicensingRestaurant operations - Franchise royalties and feesRestaurant operations - OtherTotal revenuesGross profit (calculated)Restaurant cost of salesOperating profit (calculated)Operating expenses (calculated)Selling, general and administrativeInsurance losses and underwriting expensesDepreciation, depletion, and amortizationInterest expense on borrowingsOil and gas production costsLicensing and media costsGain on sale of oil and gas propertiesInterest expense on leasesTotal other income (expenses)Earnings (loss) before income taxesNet earnings (loss)Income tax expense (benefit)Total other income (expenses)Total other income(expenses)$30.60 MEarnings (loss) before income taxesEarnings (loss)before income taxes$32.74 MGross profit (calculated)Gross profit(calculated)$127.41 MOperating profit (calculated)Operating profit(calculated)$2.13 MNet earnings (loss)Net earnings (loss)$25.40 MTotal revenuesTotal revenues$206.01 MOperating expenses (calculated)Operating expenses(calculated)$125.28 MRestaurant operations - Net salesRestaurant operations - Net sales$86.00 MIncome tax expense (benefit)Income taxexpense (benefit)$7.34 MSelling, general and administrativeSelling, general and administrative$51.10 MRestaurant operations - Franchise partner feesRestaurant operations -Franchise partner fees$43.68 MInsurance losses and underwriting expensesInsurance losses andunderwriting expenses$29.96 MRestaurant cost of salesRestaurantcost of sales$78.59 MInsurance SegmentInsurance Segment$37.97 MDepreciation, depletion, and amortizationDepreciation, depletion,and amortization$20.81 MOil And Gas SegmentOil And Gas Segment$20.40 MInterest expense on borrowingsInterest expense on borrowings$11.18 MBrand LicensingBrand Licensing$6.77 MOil and gas production costsOil and gas production costs$8.07 MRestaurant operations - Franchise royalties and feesRestaurant operations -Franchise royalties and fees$6.48 MLicensing and media costsLicensing and media costs$6.21 MGain on sale of oil and gas propertiesGain on sale of oiland gas properties−$4.80 MRestaurant operations - OtherRestaurant operations - Other$4.72 MInterest expense on leasesInterest expense on leases$2.76 M
Chart details

BIGLARI HOLDINGS INC. (BH-A) FY2026 YTD Q2 P&L / Income Statement

Income statement for 2026-01-01 through 2026-06-30. View: Segments by Product and Service. Revenue uses this breakdown; costs and expenses retain the consolidated categories.

Total revenues
206,005,000 US dollars
Restaurant cost of sales
78,592,000 US dollars
Gross profit (calculated)
127,413,000 US dollars
Operating expenses (calculated)
125,280,000 US dollars
Operating profit (calculated)
2,133,000 US dollars
Total other income (expenses)
30,604,000 US dollars
Earnings (loss) before income taxes
32,737,000 US dollars
Income tax expense (benefit)
7,342,000 US dollars
Net earnings (loss)
25,395,000 US dollars
Brand Licensing
6,768,000 US dollars
Insurance Segment
37,968,000 US dollars
Oil And Gas Segment
20,396,000 US dollars
Restaurant operations - Franchise partner fees
43,682,000 US dollars
Restaurant operations - Other
4,720,000 US dollars
Restaurant operations - Net sales
85,995,000 US dollars
Restaurant operations - Franchise royalties and fees
6,476,000 US dollars
Impairments
0 US dollars
Interest expense on leases
2,757,000 US dollars
Licensing and media costs
6,209,000 US dollars
Selling, general and administrative
51,102,000 US dollars
Oil and gas production costs
8,071,000 US dollars
Insurance losses and underwriting expenses
29,955,000 US dollars
Depreciation, depletion, and amortization
20,806,000 US dollars
Interest expense on borrowings
11,183,000 US dollars
Gain on sale of oil and gas properties
negative 4,803,000 US dollars

Chart connections

  • Revenue less cost of revenue equals gross profit; gross profit less operating expenses equals operating income.
  • Operating income plus other income or expense equals income before tax. Income before tax less income tax expense or benefit equals net income.
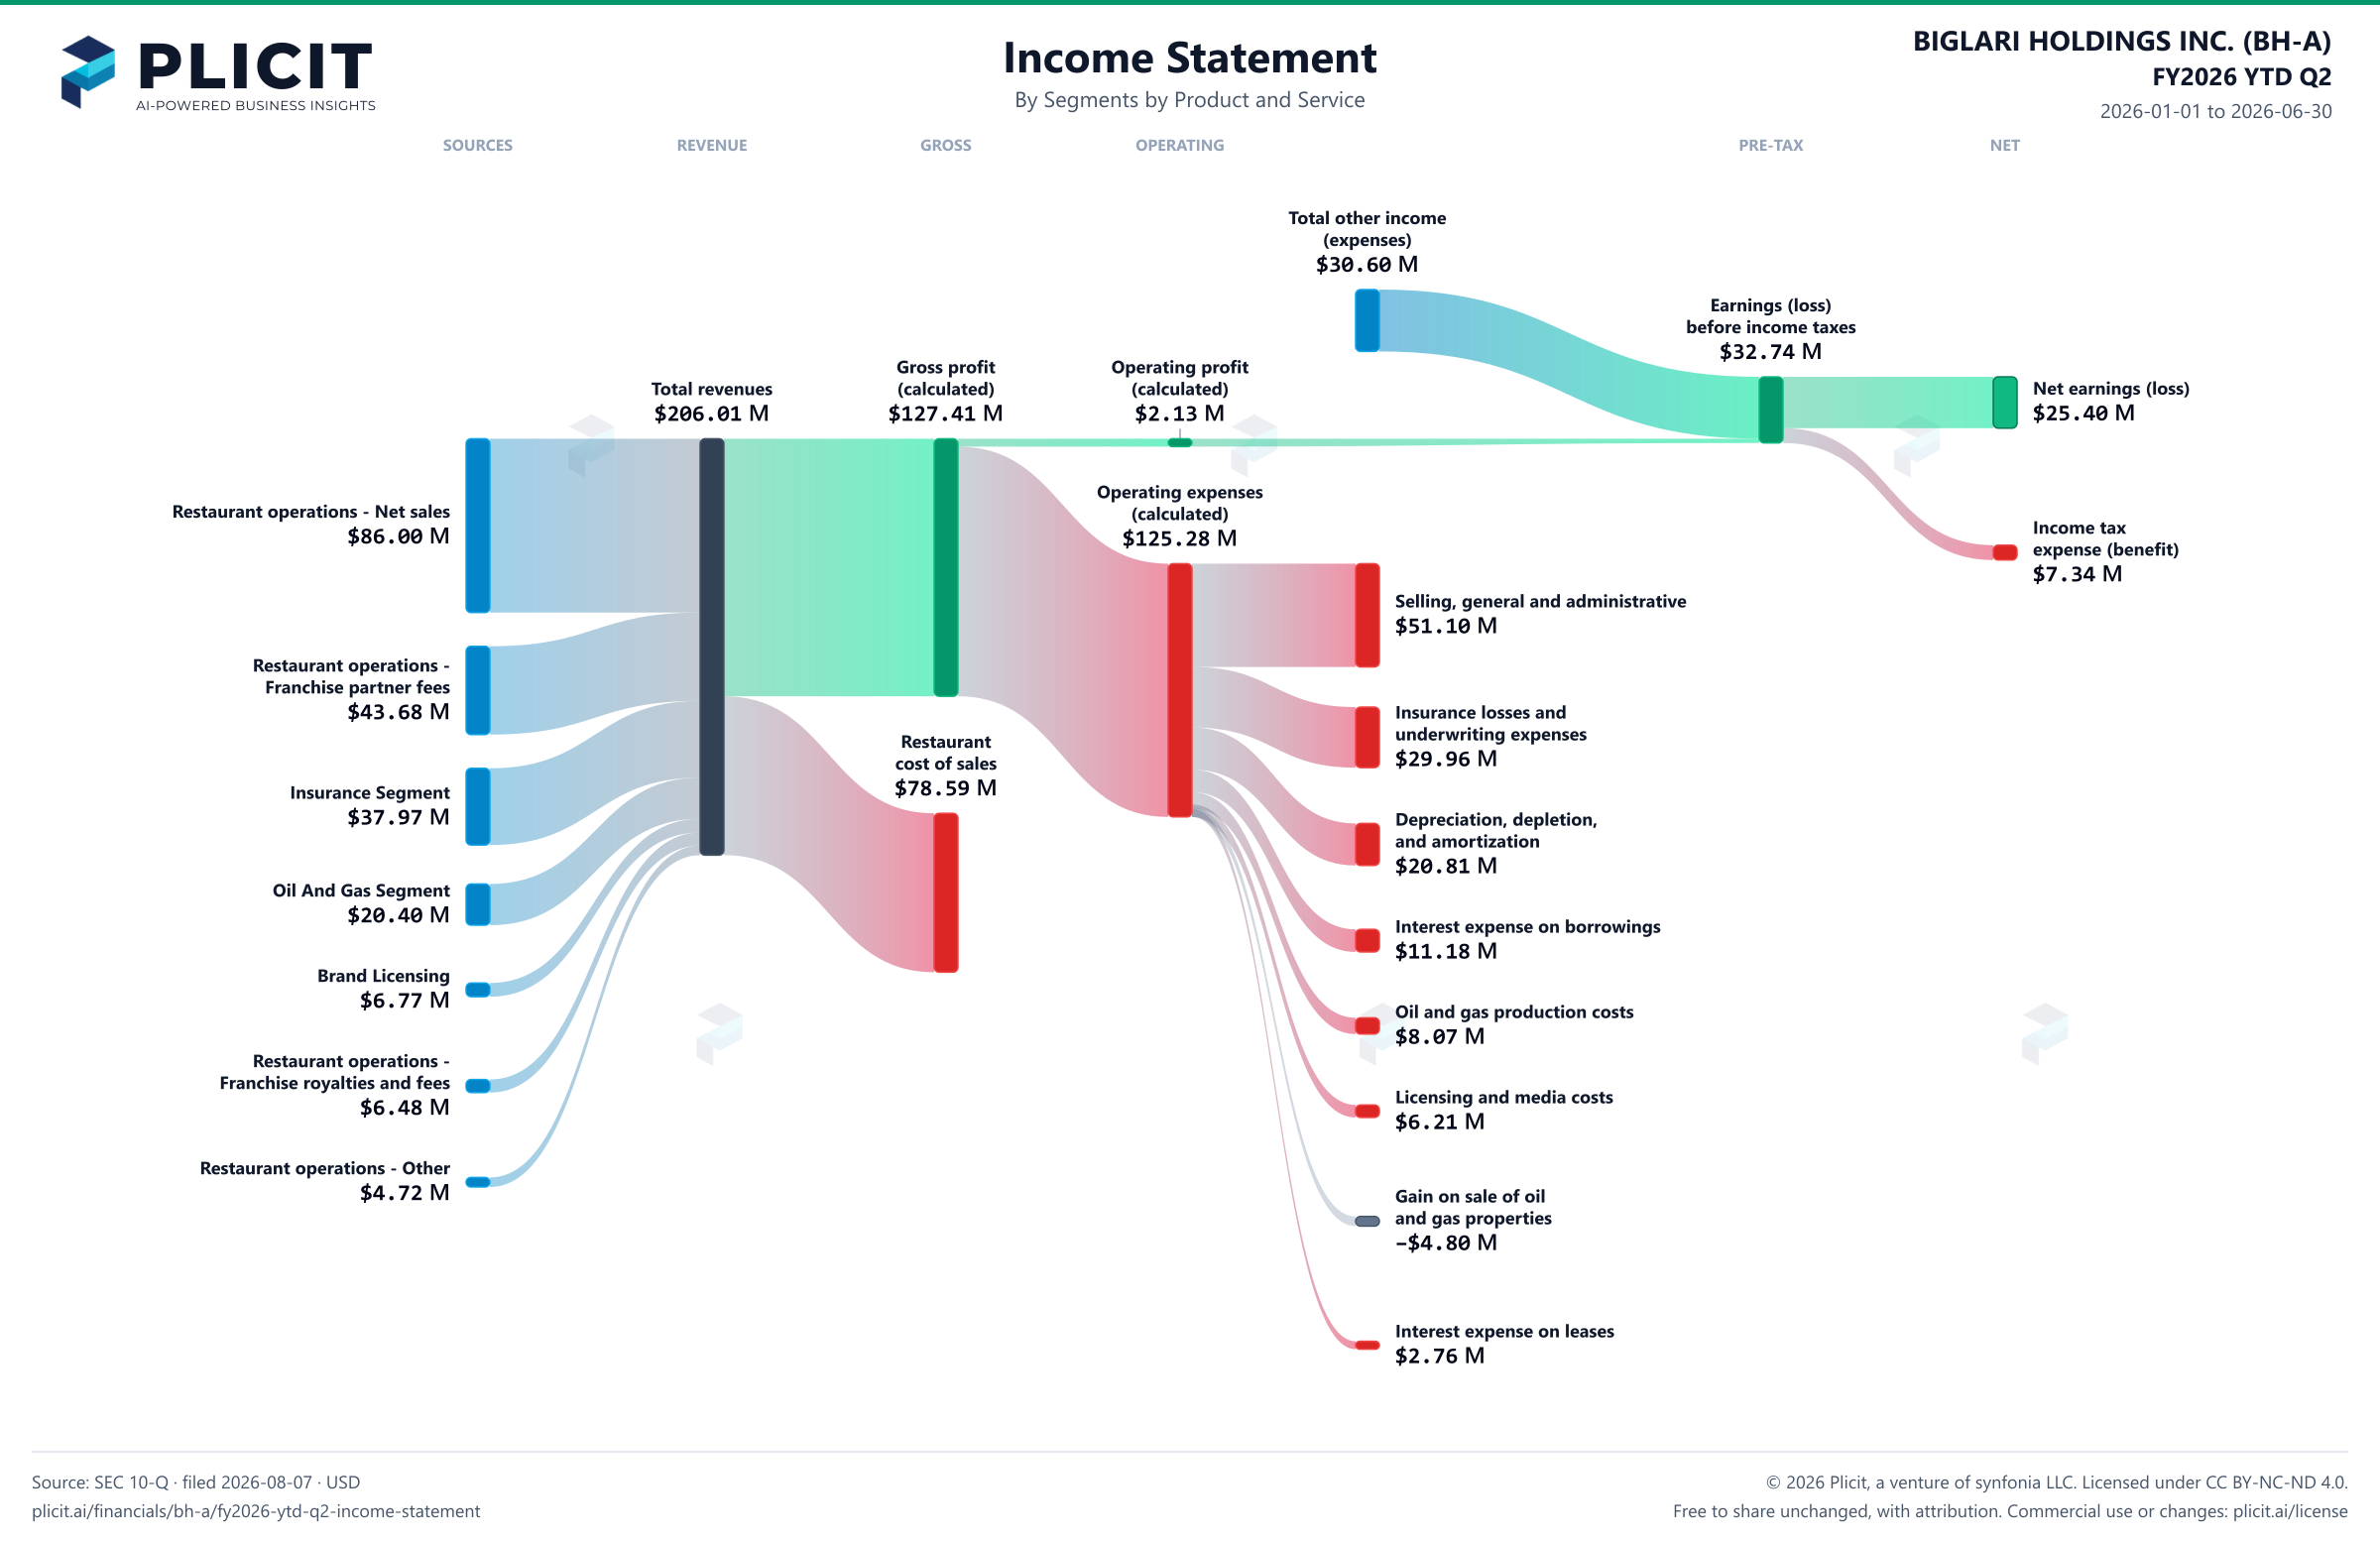
BIGLARI HOLDINGS INC. (BH-A) FY2026 YTD Q2 Revenue by Business Segment by Product and Service Sankey chart
Free to share unchanged, with credit to Plicit.ai · CC BY-NC-ND 4.0Download PNG

Gross margin

61.8%

Gross profit / revenue

Operating margin

1.0%

Operating profit / revenue

Cash conversion

138.9%

Operating cash / net income, same period

Newsletter

Get the teardowns by email

Subscribe if you want the public-company teardowns in your inbox when they're released.

Product waitlist

Health Check and Teardown for your own company

A health check uncovers insights of your private books, not a public ticker. Join this list to get notified as soon as we go-live!