
BIOGEN INC. (BIIB) FY2024 Annual P&L / Income Statement
2024-01-01 to 2024-12-31
Revenue by Product and Service
2024-01-01 to 2024-12-31
Swipe to see the full flow
Chart details
BIOGEN INC. (BIIB) FY2024 Annual P&L / Income Statement
Income statement for 2024-01-01 through 2024-12-31. View: Product and service (Revenues by Product). Revenue uses this breakdown; costs and expenses retain the consolidated categories.
- Revenues
- 9,675,900,000 US dollars
- Cost of sales, excluding amortization and impairment of acquired intangible assets
- 2,310,400,000 US dollars
- Gross profit (calculated)
- 7,365,500,000 US dollars
- Operating expenses (calculated)
- 5,459,500,000 US dollars
- Operating profit (calculated)
- 1,906,000,000 US dollars
- Other income (expense), net (calculated)
- 0 US dollars
- Income before income tax (benefit) expense and equity in (income) loss of investee, net of tax
- 1,906,000,000 US dollars
- Income tax (benefit) expense
- 273,800,000 US dollars
- Net income
- 1,632,200,000 US dollars
- BENEPALI
- 479,100,000 US dollars
- IMRALDI
- 213,100,000 US dollars
- FLIXABI
- 63,200,000 US dollars
- BYOOVIZ
- 36,600,000 US dollars
- TOFIDENCE
- 1,100,000 US dollars
- TECFIDERA
- 967,100,000 US dollars
- VUMERITY
- 628,000,000 US dollars
- AVONEX
- 707,500,000 US dollars
- PLEGRIDY
- 260,500,000 US dollars
- TYSABRI product
- 1,715,000,000 US dollars
- FAMPYRA
- 71,700,000 US dollars
- ZURZUVAE
- 72,200,000 US dollars
- FUMADERM And ADUHELM
- 10,300,000 US dollars
- SPINRAZA
- 1,573,200,000 US dollars
- QALSODY
- 32,400,000 US dollars
- SKYCLARYS
- 382,500,000 US dollars
- Alzheimer's collaboration revenue
- 59,900,000 US dollars
- Contract manufacturing, royalty and other revenue
- 652,600,000 US dollars
- Revenue from anti-CD20 therapeutic programs
- 1,749,900,000 US dollars
- Research and development
- 2,041,800,000 US dollars
- Selling, general and administrative
- 2,403,700,000 US dollars
- Amortization and impairment of acquired intangible assets
- 446,700,000 US dollars
- Gain on sale of priority review voucher, net
- negative 88,600,000 US dollars
- Collaboration profit sharing/(loss reimbursement)
- 254,400,000 US dollars
- Gain on sale of building, net
- 0 US dollars
- Other (income) expense, net
- 343,600,000 US dollars
- (Gain) loss on fair value remeasurement of contingent consideration
- 27,700,000 US dollars
- Restructuring charges
- 30,200,000 US dollars
- Equity in (income) loss of investee, net of tax
- 0 US dollars. Reported below-tax contribution to net income.
Chart connections
- Revenue less cost of revenue equals gross profit; gross profit less operating expenses equals operating income.
- Operating income plus other income or expense equals income before tax. Income before tax less income tax expense or benefit, plus the explicitly reported below-tax contributions, equals net income.
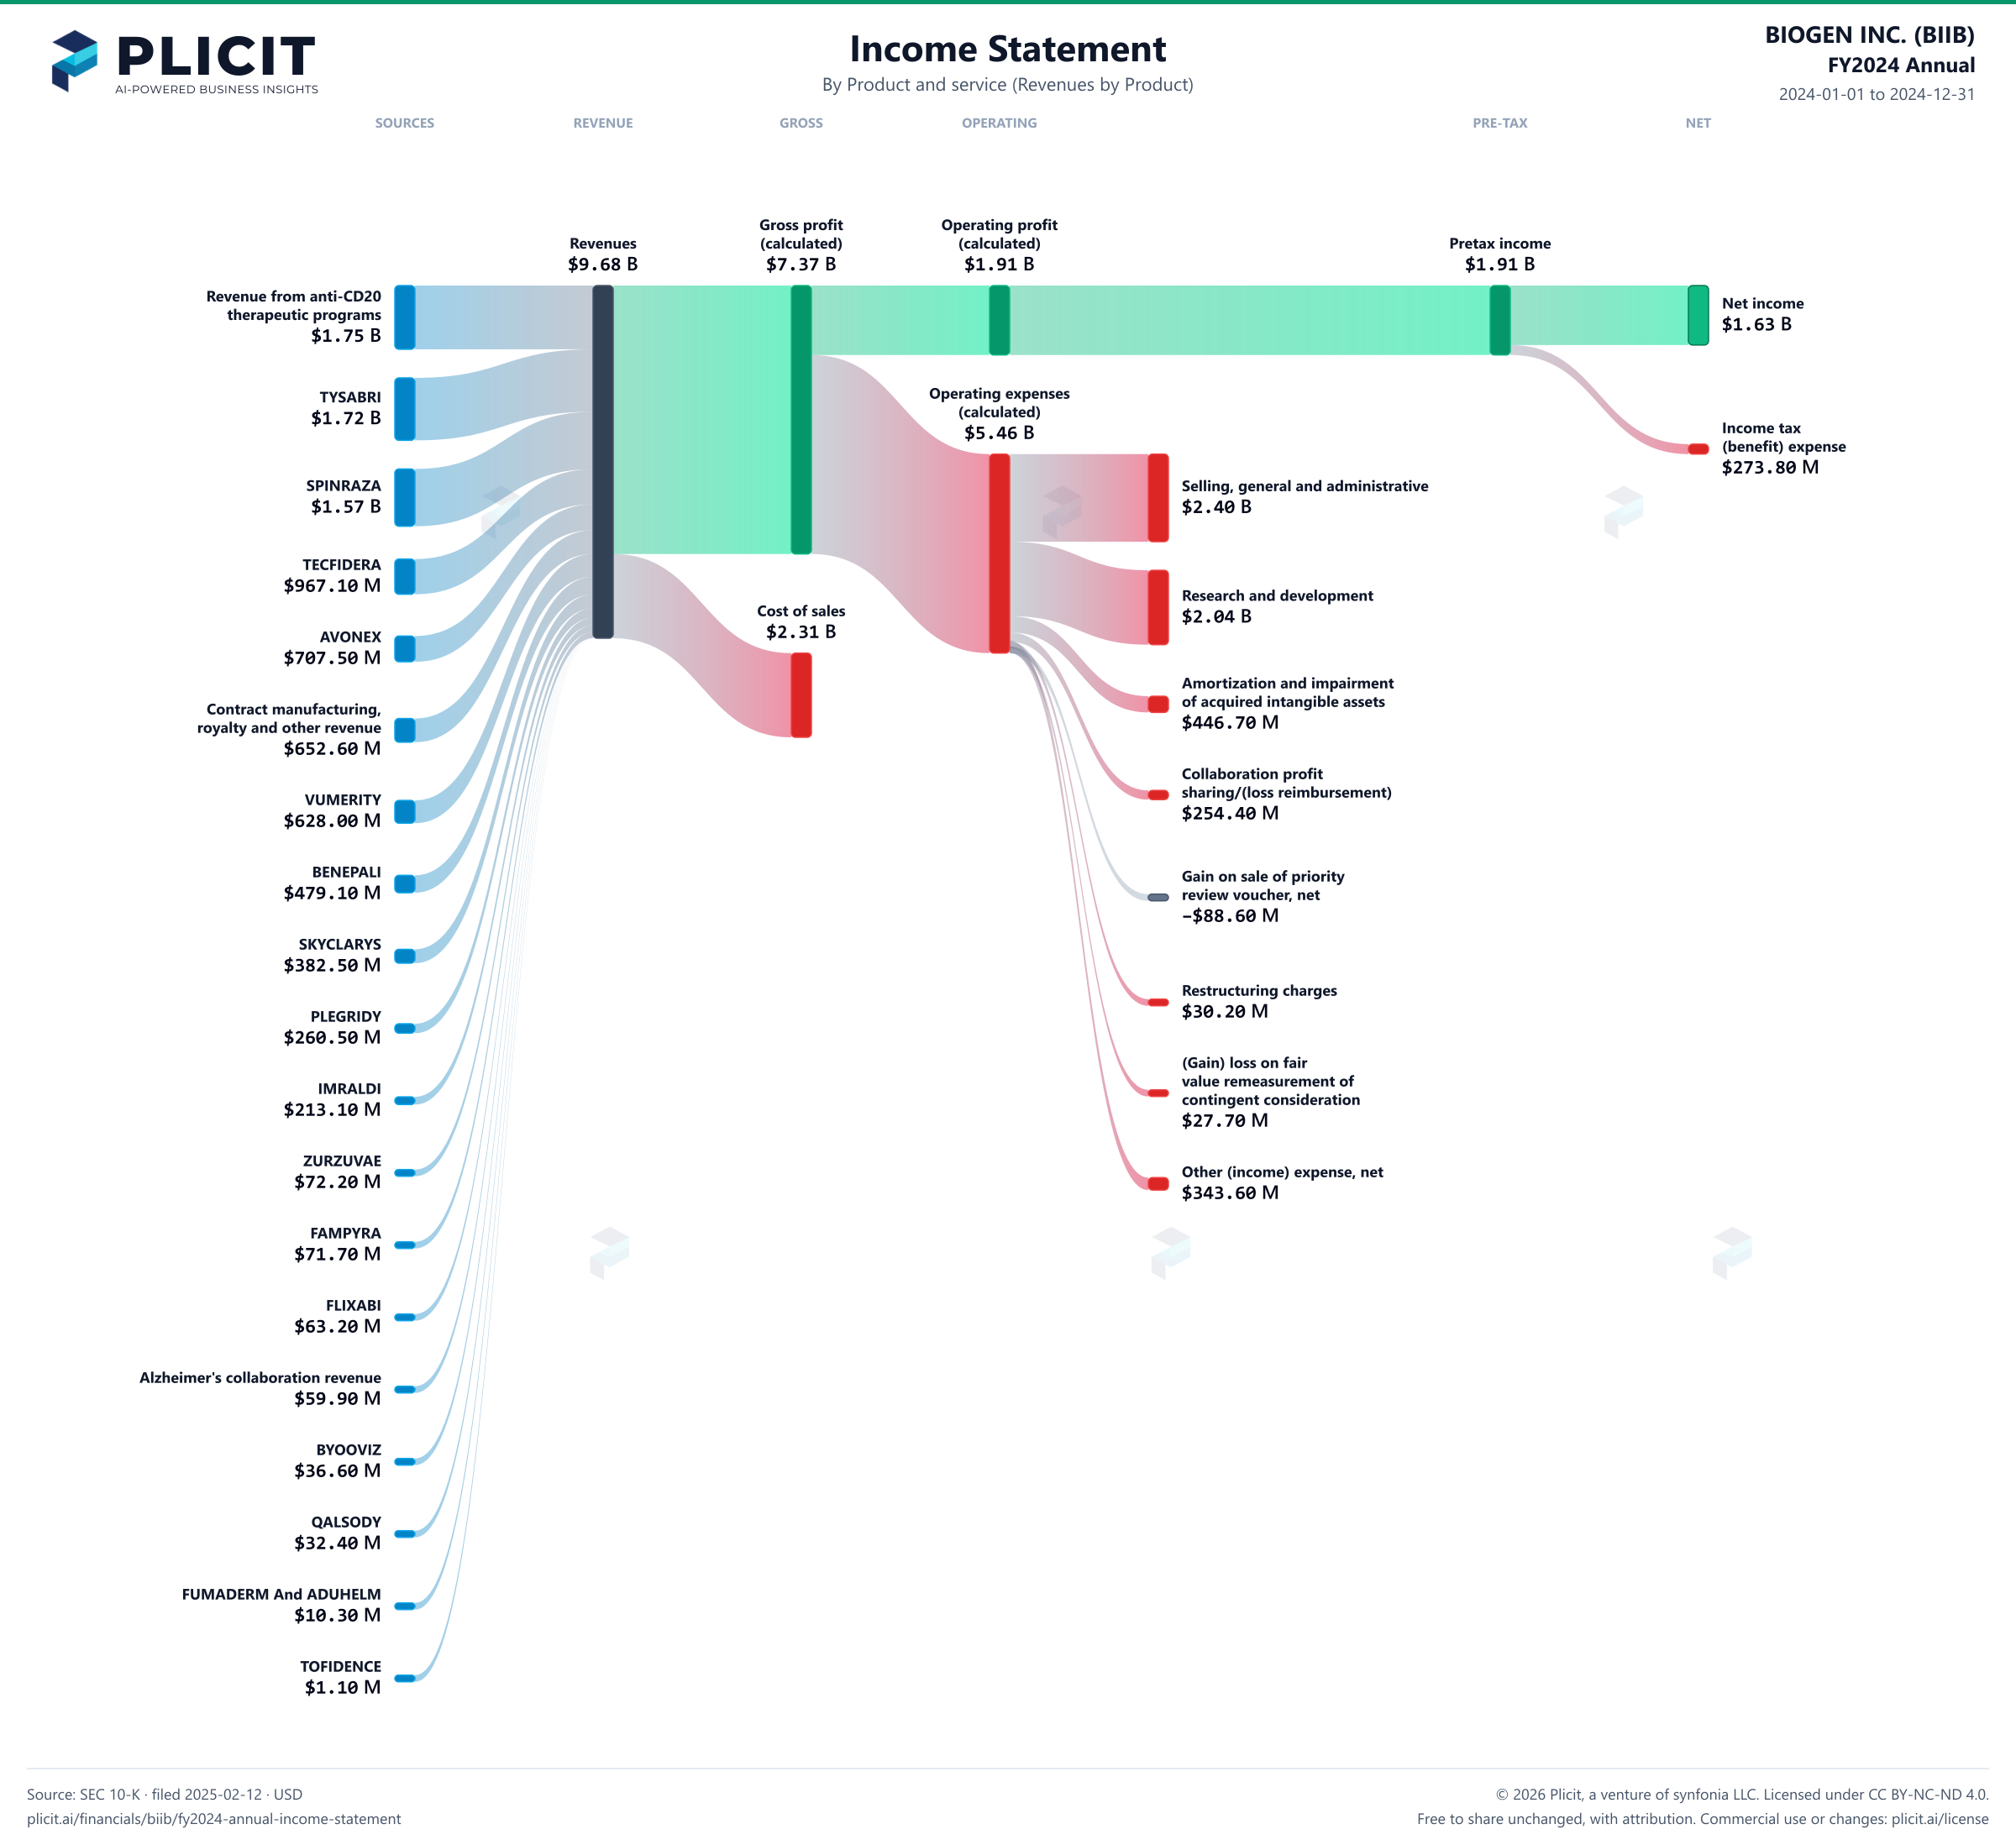
Free to share unchanged, with credit to Plicit.ai · CC BY-NC-ND 4.0Download PNG
Gross margin
76.1%
Gross profit / revenue
Operating margin
19.7%
Operating profit / revenue
Cash conversion
176.2%
Operating cash / net income, same period
Product waitlist
Health Check and Teardown for your own company
A health check uncovers insights of your private books, not a public ticker. Join this list to get notified as soon as we go-live!