
BADGER METER, INC. (BMI) FY2026 Q2 Balance Sheet

Balance Sheet

As of 2026-06-30

Swipe to see the full flow
BADGER METER, INC. (BMI) FY2026 Q2 Balance SheetBalance sheet as of 2026-06-30. The chart shows assets, liabilities and equity at that date.Current liabilities$171.87 MLiabilities(calculated)$315.29 MCurrent assets$416.21 MAssets$998.17 MNon-current liabilities$143.42 MEquity$682.88 MNon-current assets$581.96 MGross equity(calculated)$797.26 MHOLDINGSASSET CLASSASSETSCLAIM CLASSCLAIM SUB-CLASSCLAIMSRaw materialsReceivables, net of allowance for doubtful accountsCash and cash equivalentsWork in processPrepaid expenses and other current assetsFinished goodsGoodwillIntangible assets, at cost less accumulated amortizationNet property, plant and equipmentOther assetsDeferred income taxesPayablesOther current liabilitiesAccrued compensation and employee benefitsWarranty and after-sale costs, currentLong-term deferred revenueOther long-term liabilitiesDeferred income taxesWarranty and after-sale costs, long-termOther accrued employee benefitsAccrued non-pension postretirement benefitsReinvested earningsCapital in excess of par valueCommon stock, $1 par, authorized 80,000,000, issued 37,221,098 shares in 2026 and 2025Accumulated other comprehensive incomeCurrent assetsNon-current assetsAssetsCurrent liabilitiesNon-current liabilitiesLiabilities (calculated)EquityGross equity (calculated)Less: Treasury stock, at cost, 8,234,251 shares in 2026 and 7,834,360 in 2025PayablesPayables$97.83 MCurrent liabilitiesCurrent liabilities$171.87 MOther current liabilitiesOther current liabilities$46.35 MLiabilities (calculated)Liabilities(calculated)$315.29 MAccrued compensation and employee benefitsAccrued compensation and employee benefits$18.73 MRaw materialsRaw materials$126.60 MWarranty and after-sale costs, currentWarranty and after-sale costs, current$8.96 MCurrent assetsCurrent assets$416.21 MReceivables, net of allowance for doubtful accountsReceivables, net of allowance for doubtful accounts$121.23 MLong-term deferred revenueLong-term deferred revenue$78.78 MAssetsAssets$998.17 MCash and cash equivalentsCash and cash equivalents$95.73 MOther long-term liabilitiesOther long-term liabilities$23.48 MNon-current liabilitiesNon-current liabilities$143.42 MWork in processWork in process$32.56 MDeferred income taxesDeferred income taxes$16.69 MPrepaid expenses and other current assetsPrepaid expenses and other current assets$21.15 MWarranty and after-sale costs, long-termWarranty and after-sale costs, long-term$14.74 MFinished goodsFinished goods$18.93 MEquityEquity$682.88 MOther accrued employee benefitsOther accrued employee benefits$7.23 MNon-current assetsNon-current assets$581.96 MAccrued non-pension postretirement benefitsAccrued non-pension postretirement benefits$2.50 MGoodwillGoodwill$302.61 MGross equity (calculated)Gross equity(calculated)$797.26 MIntangible assets, at cost less accumulated amortizationIntangible assets$162.54 MReinvested earningsReinvested earnings$679.65 MNet property, plant and equipmentNet property, plant and equipment$83.44 MOther assetsOther assets$19.27 MDeferred income taxesDeferred income taxes$14.11 MCapital in excess of par valueCapital in excess of par value$80.12 MCommon stock, $1 par, authorized 80,000,000, issued 37,221,098 shares in 2026 and 2025Common stock$37.22 MAccumulated other comprehensive incomeAccumulated other comprehensive income$265.00 KLess: Treasury stock, at cost, 8,234,251 shares in 2026 and 7,834,360 in 2025Less: Treasury stock−$114.38 M
Chart details

BADGER METER, INC. (BMI) FY2026 Q2 Balance Sheet

Balance sheet as of 2026-06-30. The chart shows assets, liabilities and equity at that date.

Assets
998,169,000 US dollars
Current assets
416,205,000 US dollars
Non-current assets
581,964,000 US dollars
Liabilities (calculated)
315,289,000 US dollars
Current liabilities
171,872,000 US dollars
Non-current liabilities
143,417,000 US dollars
Equity
682,880,000 US dollars
Property, plant and equipment, at cost
256,564,000 US dollars. Part of Net property, plant and equipment, drawn as one net amount.
Less accumulated depreciation
negative 173,127,000 US dollars. Part of Net property, plant and equipment, drawn as one net amount.
Raw materials
126,604,000 US dollars
Receivables, net of allowance for doubtful accounts
121,234,000 US dollars
Cash and cash equivalents
95,733,000 US dollars
Work in process
32,560,000 US dollars
Prepaid expenses and other current assets
21,147,000 US dollars
Finished goods
18,927,000 US dollars
Goodwill
302,609,000 US dollars
Intangible assets, at cost less accumulated amortization
162,540,000 US dollars
Net property, plant and equipment
83,437,000 US dollars
Other assets
19,269,000 US dollars
Deferred income taxes
14,109,000 US dollars
Payables
97,827,000 US dollars
Other current liabilities
46,351,000 US dollars
Accrued compensation and employee benefits
18,734,000 US dollars
Warranty and after-sale costs, current
8,960,000 US dollars
Long-term deferred revenue
78,784,000 US dollars
Other long-term liabilities
23,478,000 US dollars
Deferred income taxes
16,692,000 US dollars
Warranty and after-sale costs, long-term
14,737,000 US dollars
Other accrued employee benefits
7,225,000 US dollars
Accrued non-pension postretirement benefits
2,501,000 US dollars
Reinvested earnings
679,651,000 US dollars
Capital in excess of par value
80,123,000 US dollars
Common stock, $1 par, authorized 80,000,000, issued 37,221,098 shares in 2026 and 2025
37,221,000 US dollars
Accumulated other comprehensive income
265,000 US dollars
Less: Treasury stock, at cost, 8,234,251 shares in 2026 and 7,834,360 in 2025
negative 114,380,000 US dollars
Gross equity (calculated)
797,260,000 US dollars. Net equity plus the magnitudes of its negative contributions equals gross positive equity. The negative contributions enter this reconciliation as add-backs; their filed signs stay negative.

Chart connections

  • Assets equal liabilities plus consolidated equity. Consolidated equity includes noncontrolling interests when reported.
  • Treasury shares and other negative equity contributions reduce equity.
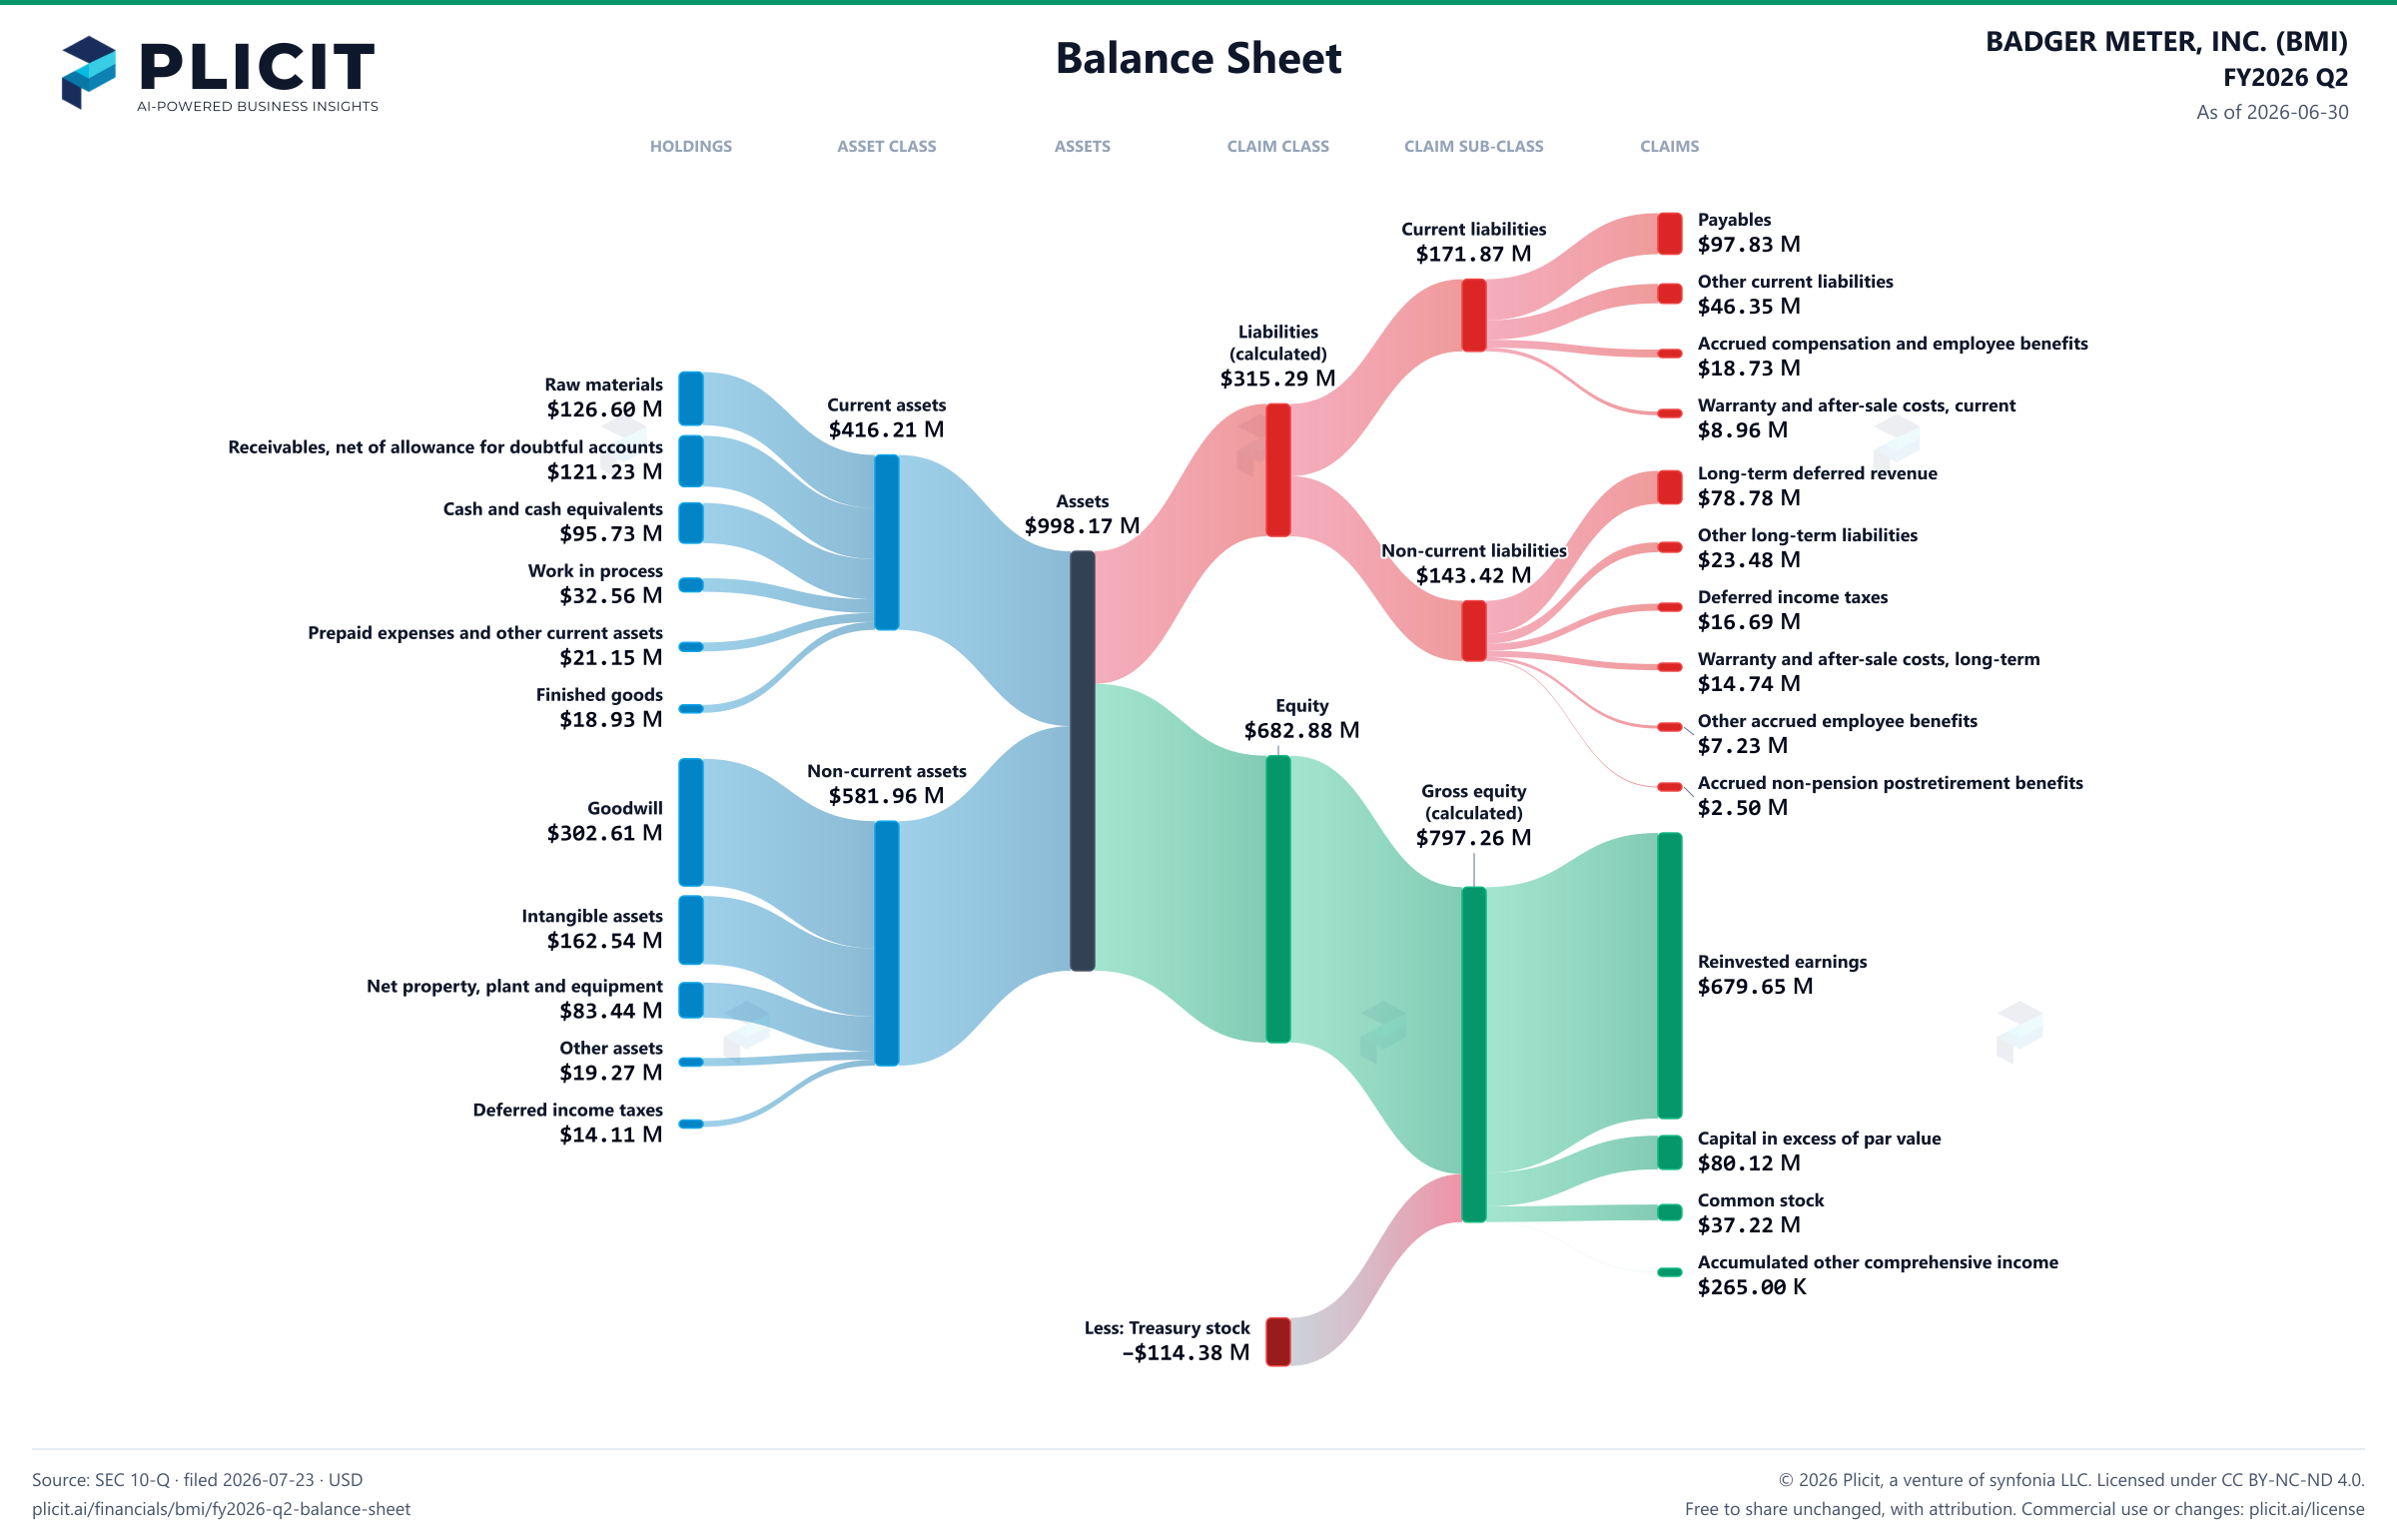
BADGER METER, INC. (BMI) FY2026 Q2 Balance Sheet Sankey chart
Free to share unchanged, with credit to Plicit.ai · CC BY-NC-ND 4.0Download PNG

Newsletter

Get the teardowns by email

Subscribe if you want the public-company teardowns in your inbox when they're released.

Product waitlist

Health Check and Teardown for your own company

A health check uncovers insights of your private books, not a public ticker. Join this list to get notified as soon as we go-live!