
BROADRIDGE FINANCIAL SOLUTIONS, INC. (BR) FY2026 Annual Balance Sheet

Published · Updated Source: Form 10-K on SEC EDGAR filed (opens in a new tab)

Key Takeaways

  • Other assets jumped 42% to $1.43 B, led by $216.10 M of Canton Coins it did not hold a year ago.
  • Goodwill and intangibles reach $4.99 B, 56% of assets and more than shareholders' equity.
  • Strip those out and net worth is -$2.15 B, a slight improvement on -$2.23 B a year ago.
  • Cash fell 28% to $402.90 M against $3.25 B of debt, but none of that debt is due within a year.

The Unvarnished Truth

Broadridge's balance sheet now carries $216.10 M of crypto tokens

The newest asset on Broadridge's balance sheet is not a data center or a software platform. It is a pile of crypto tokens. On June 30, 2026, other non-current assets held $216.10 M of digital assets, a line that was empty a year earlier, plus $31.60 M of warrants received for coins handed to a company called CNTN. Those items help explain why other assets jumped 42% to $1.43 B while sales grew 9%. The coins carry a cost basis of just $13.30 M, so almost all of their value is market price.

Why does that matter for a company built on investor communications? Because the balance sheet has little cushion beneath it. Goodwill and other intangibles from past acquisitions total $4.99 B, 56% of everything Broadridge owns and more than its $2.84 B of equity. Subtract them and net worth is -$2.15 B. Debt stands at $3.25 B against $402.90 M of cash, which fell 28% in the year. And 1.3 billion of the coins, valued at $189.90 M, are locked up and cannot be transferred, so they are no ready cushion either.

For lenders, the picture is steadier than it looks: none of the $3.27 B repayment schedule falls due within a year, and the largest slice, $1.75 B, comes in 2031. Broadridge also reports $1.23 B of unused borrowing capacity, and asset write-downs were a modest $5.30 M. For shareholders, the open question is the coins. Their price only became observable when the tokens listed on public exchanges, and it now moves Broadridge's assets and profit. If that price falls, how much of this new asset will be left?
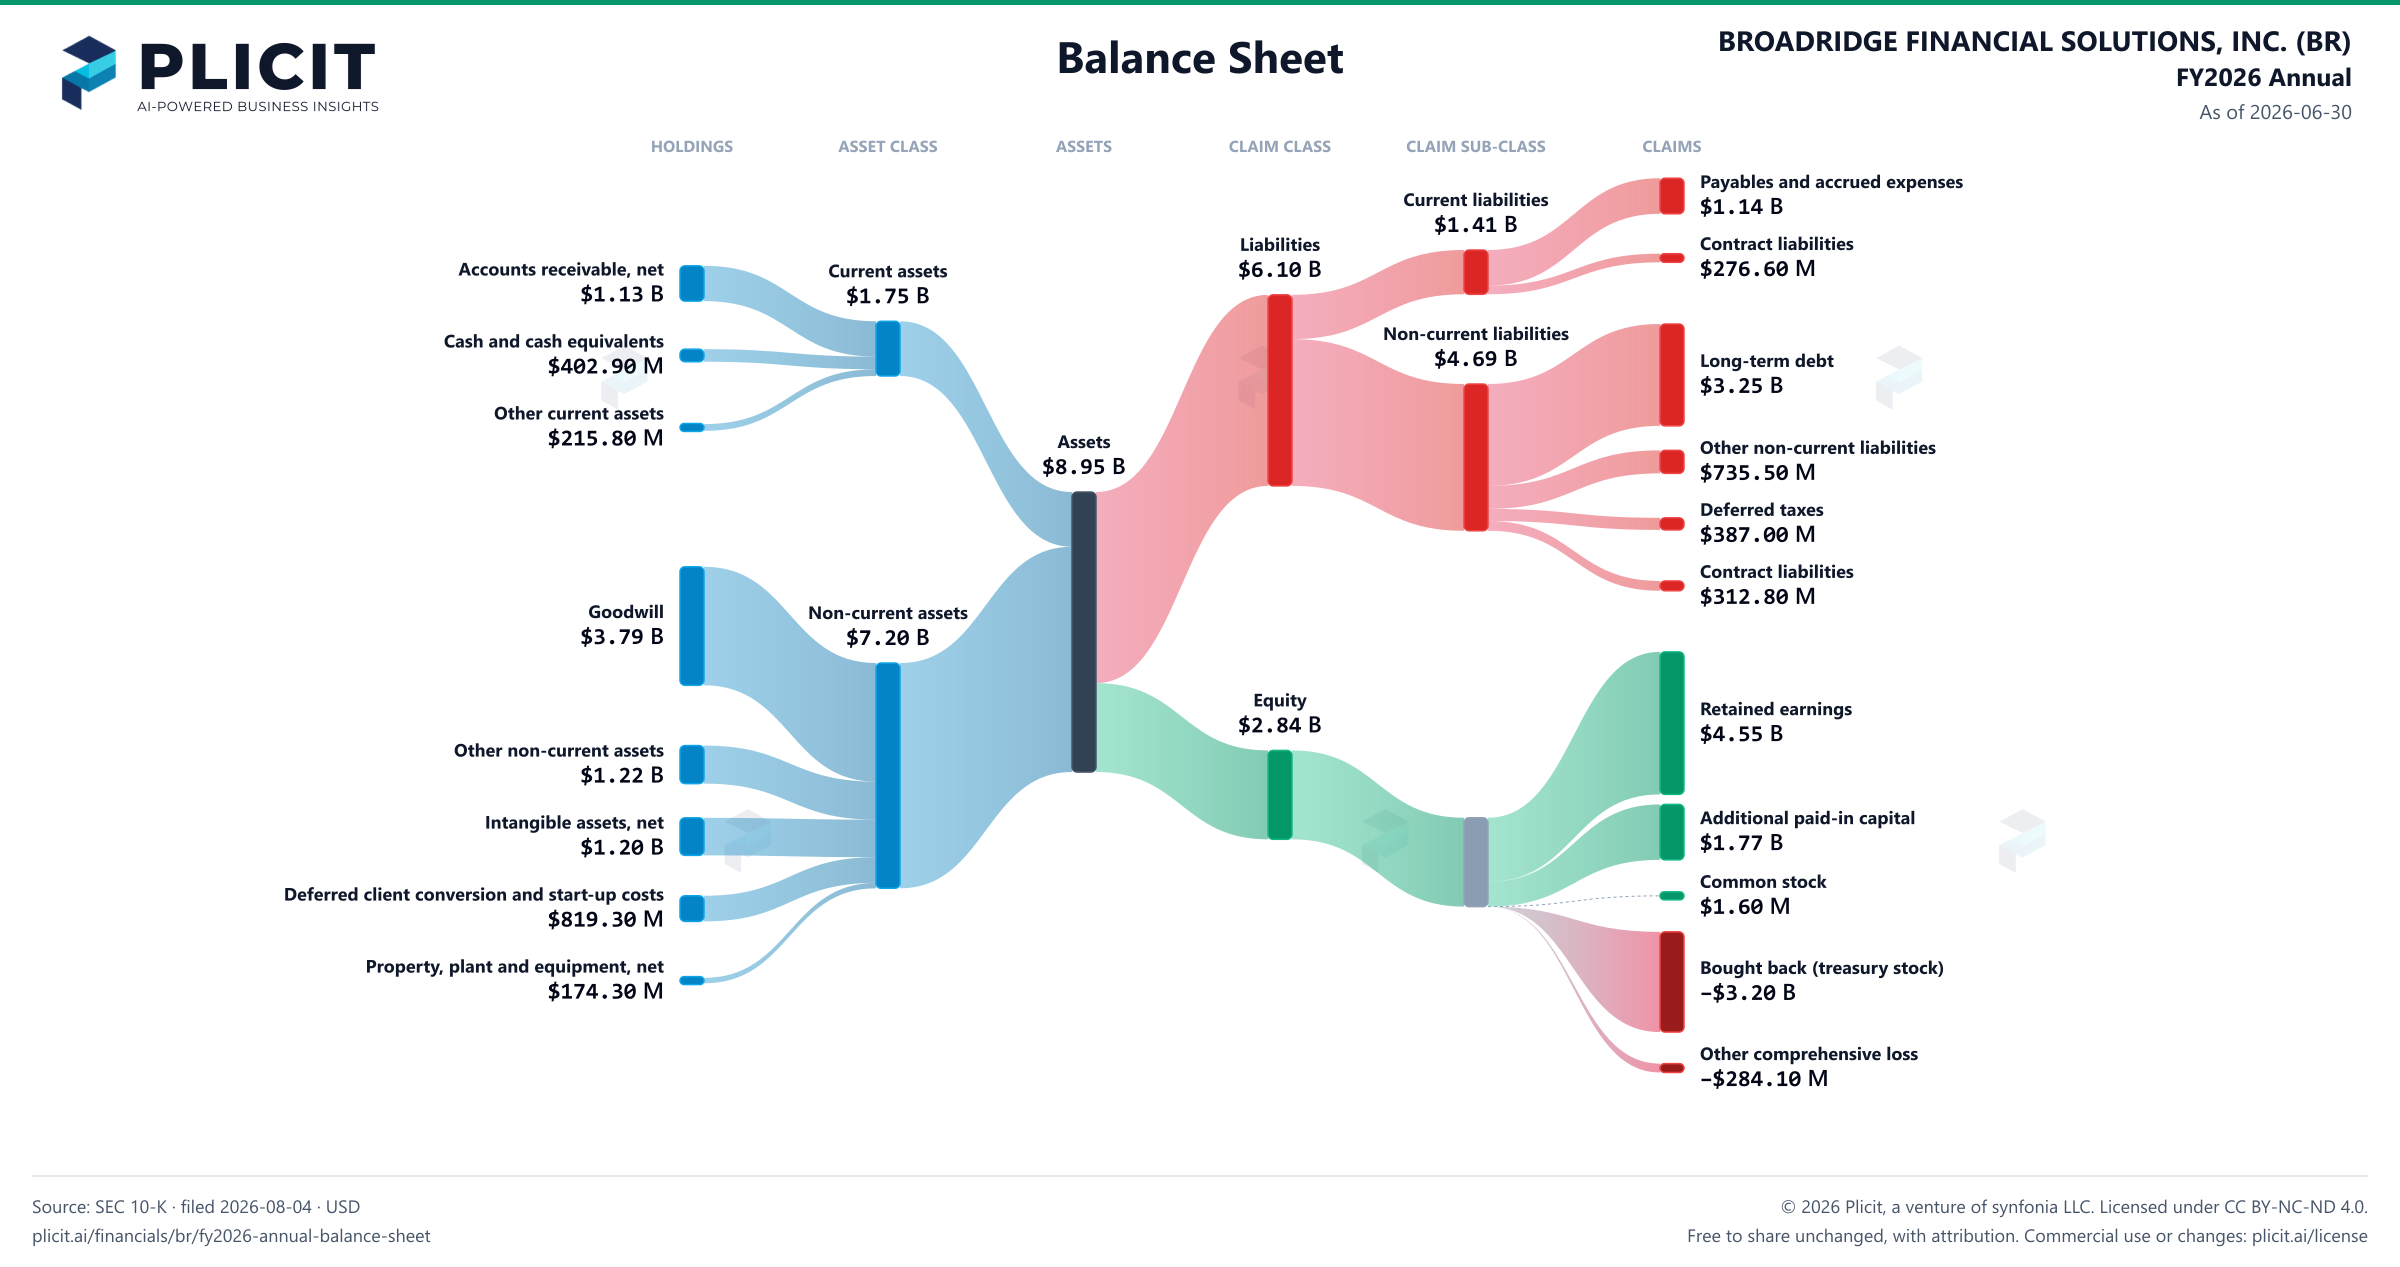
As of 2026-06-30

Balance Sheet

Swipe to see the full flow
BROADRIDGE FINANCIAL SOLUTIONS, INC. (BR) FY2026 Annual Balance SheetBalance sheet as of 2026-06-30. The chart shows assets, liabilities and equity at that date.Current liabilities$1.41 BLiabilities$6.10 BCurrent assets$1.75 BNon-current liabilities$4.69 BAssets$8.95 BNon-current assets$7.20 BEquity$2.84 BHOLDINGSASSET CLASSASSETSCLAIM CLASSCLAIM SUB-CLASSCLAIMSAccounts receivable, net of allowance for doubtful accounts of $13.2 and $12.5, respectivelyCash and cash equivalentsOther current assetsGoodwillOther non-current assetsIntangible assets, netDeferred client conversion and start-up costsProperty, plant and equipment, netPayables and accrued expensesContract liabilitiesLong-term debtOther non-current liabilitiesDeferred taxesContract liabilitiesRetained earningsAdditional paid-in capitalCommon stock, $0.01 par value: Authorized, 650.0 shares; issued, 154.5 and 154.5 shares, respectively; outstanding, 114.0 and 117.1 shares, respectivelyTreasury stock, at cost: 40.4 and 37.3 shares, respectivelyAccumulated other comprehensive income (loss)Current assetsNon-current assetsAssetsCurrent liabilitiesNon-current liabilitiesLiabilitiesEquityEquityPayables and accrued expensesPayables and accrued expenses$1.14 BCurrent liabilitiesCurrent liabilities$1.41 BContract liabilitiesContract liabilities$276.60 MLiabilitiesLiabilities$6.10 BAccounts receivable, net of allowance for doubtful accounts of $13.2 and $12.5, respectivelyAccounts receivable, net$1.13 BCurrent assetsCurrent assets$1.75 BNon-current liabilitiesNon-current liabilities$4.69 BCash and cash equivalentsCash and cash equivalents$402.90 MLong-term debtLong-term debt$3.25 BOther current assetsOther current assets$215.80 MAssetsAssets$8.95 BOther non-current liabilitiesOther non-current liabilities$735.50 MDeferred taxesDeferred taxes$387.00 MContract liabilitiesContract liabilities$312.80 MGoodwillGoodwill$3.79 BNon-current assetsNon-current assets$7.20 BEquityEquity$2.84 BRetained earningsRetained earnings$4.55 BOther non-current assetsOther non-current assets$1.22 BAdditional paid-in capitalAdditional paid-in capital$1.77 BIntangible assets, netIntangible assets, net$1.20 BCommon stock, $0.01 par value: Authorized, 650.0 shares; issued, 154.5 and 154.5 shares, respectively; outstanding, 114.0 and 117.1 shares, respectivelyCommon stock$1.60 MDeferred client conversion and start-up costsDeferred client conversion and start-up costs$819.30 MProperty, plant and equipment, netProperty, plant and equipment, net$174.30 MTreasury stock, at cost: 40.4 and 37.3 shares, respectivelyBought back (treasury stock)−$3.20 BAccumulated other comprehensive income (loss)Other comprehensive loss−$284.10 M
Chart details

BROADRIDGE FINANCIAL SOLUTIONS, INC. (BR) FY2026 Annual Balance Sheet

Balance sheet as of 2026-06-30. The chart shows assets, liabilities and equity at that date.

Assets
8,945,300,000 US dollars
Current assets
1,748,100,000 US dollars
Non-current assets
7,197,200,000 US dollars
Liabilities
6,104,700,000 US dollars
Current liabilities
1,414,800,000 US dollars
Non-current liabilities
4,689,900,000 US dollars
Equity
2,840,500,000 US dollars
Accounts receivable, net of allowance for doubtful accounts of $13.2 and $12.5, respectively
1,129,400,000 US dollars
Cash and cash equivalents
402,900,000 US dollars
Other current assets
215,800,000 US dollars
Goodwill
3,787,800,000 US dollars
Other non-current assets
1,215,900,000 US dollars
Intangible assets, net
1,199,900,000 US dollars
Deferred client conversion and start-up costs
819,300,000 US dollars
Property, plant and equipment, net
174,300,000 US dollars
Payables and accrued expenses
1,138,200,000 US dollars
Contract liabilities
276,600,000 US dollars
Current portion of long-term debt
0 US dollars
Long-term debt
3,254,600,000 US dollars
Other non-current liabilities
735,500,000 US dollars
Deferred taxes
387,000,000 US dollars
Contract liabilities
312,800,000 US dollars
Retained earnings
4,553,600,000 US dollars
Additional paid-in capital
1,771,200,000 US dollars
Common stock, $0.01 par value: Authorized, 650.0 shares; issued, 154.5 and 154.5 shares, respectively; outstanding, 114.0 and 117.1 shares, respectively
1,600,000 US dollars
Preferred stock: Authorized, 25.0 shares; issued and outstanding, none
0 US dollars
Treasury stock, at cost: 40.4 and 37.3 shares, respectively
negative 3,201,700,000 US dollars
Accumulated other comprehensive income (loss)
negative 284,100,000 US dollars

Chart connections

  • Assets equal liabilities plus consolidated equity. Consolidated equity includes noncontrolling interests when reported.
  • Treasury shares and other negative equity contributions reduce equity.
  • Total assets are $8,945.30 M and liabilities and equity are $8,945.20 M; the $0.10 M difference is within the rounding of the filed amounts.
  • The filed equity lines add up to $2,840.60 M and the equity total is $2,840.50 M; the $0.10 M difference is within the rounding of the filed amounts.
BROADRIDGE FINANCIAL SOLUTIONS, INC. (BR) FY2026 Annual Balance Sheet Sankey chart
Free to share unchanged, with credit to Plicit.ai · CC BY-NC-ND 4.0Download PNG

Intelligent Insights for Investors

How much of Broadridge's assets come from paying for acquisitions?

More than the owners' whole stake: goodwill and other intangible assets make up 56% of everything Broadridge owns on June 30, 2026, $4.99 B in all. That is larger than its $2.84 B of shareholders' equity.

Are Broadridge's other assets growing much faster than its sales?

Yes: other assets grew 42% from a year earlier, to $1.43 B, 16% of its assets, while sales grew 9% in the year. The notes show why: other non-current assets now include $216.10 M of digital assets, Canton Coins carried at market value.

What is Broadridge's net worth after subtracting goodwill and intangibles?

Below zero, though book equity is positive: shareholders' equity less goodwill and other intangible assets was -$2.15 B on June 30, 2026, against -$2.23 B a year earlier.

Intelligent Insights for Lenders

When does Broadridge's debt come due?

Mostly in a few years: the largest year in Broadridge's $3.27 B debt repayment schedule is 2031, with $1.75 B. None of it is due within a year.

How much unused borrowing capacity does Broadridge report?

Broadridge reported $1.23 B of unused borrowing capacity under its credit facilities on June 30, 2026, against $402.90 M of cash on hand. Drawing on it depends on the conditions in its credit agreements.

Intelligent Insights for Employees

Is Broadridge's pension plan fully funded?

Yes: its pension plans held $70.80 M of assets against $65.90 M owed on June 30, 2026, 107% funded, against 106% a year earlier. What the plans owe is an estimate that rises when interest rates fall.

Product waitlist

Health Check and Teardown for your own company

A health check uncovers insights of your private books, not a public ticker. Join this list to get notified as soon as we go-live!