
Citigroup Inc (C) FY2026 Q1 Balance Sheet

Balance Sheet

As of 2026-03-31

Swipe to see the full flow
Citigroup Inc (C) FY2026 Q1 Balance SheetBalance sheet as of 2026-03-31. The chart shows assets, liabilities and equity at that date.Liabilities$2.57 TAssets$2.78 TEquity$212.57 BGross equity(calculated)$348.56 BHOLDINGSASSETSCLAIM CLASSCLAIM SUB-CLASSCLAIMSTotal loans, netTrading account assets (including $258,990 and $228,816 pledged to creditors as of March 31, 2026 and December 31, 2025, respectively)Deposits with banks, net of allowanceSecurities borrowed and purchased under agreements to resell (including $189,989 and $206,110 as of March 31, 2026 and December 31, 2025, respectively, at fair value), net of allowanceAvailable-for-sale debt securities (including $6,286 and $4,931 pledged to creditors as of March 31, 2026 and December 31, 2025, respectively)Held-to-maturity debt securities, net of allowance (fair value of which is $167,857 and $179,520 as of March 31, 2026 and December 31, 2025, respectively) (includes $98 and $70 pledged to creditors as of March 31, 2026 and December 31, 2025, respectively)Other assets (including $17,652 and $15,840 as of March 31, 2026 and December 31, 2025, respectively, at fair value), net of allowanceBrokerage receivables, net of allowancePremises and equipment, net of depreciation and amortizationCash and due from banks (including segregated cash and other deposits)GoodwillEquity securities (including $759 and $921 as of March 31, 2026 and December 31, 2025, respectively, at fair value)Intangible assets (including MSRs of $766 and $759 as of March 31, 2026 and December 31, 2025, respectively)Deposits (including $4,375 and $4,222 as of March 31, 2026 and December 31, 2025, respectively, at fair value)Securities loaned and sold under agreements to repurchase (including $232,048 and $199,422 as of March 31, 2026 and December 31, 2025, respectively, at fair value)Long-term debt (including $135,058 and $130,726 as of March 31, 2026 and December 31, 2025, respectively, at fair value)Trading account liabilitiesBrokerage payables (including $6,219 and $5,492 as of March 31, 2026 and December 31, 2025, respectively, at fair value)Other liabilities, plus allowancesShort-term borrowings (including $26,719 and $21,567 as of March 31, 2026 and December 31, 2025, respectively, at fair value)Retained earningsAdditional paid-in capitalPreferred stock ($1.00 par value; authorized shares: 30 million), issued shares: as of March 31, 2026—782,000 and as of December 31, 2025—802,000, at aggregate liquidation valueCommon stock ($0.01 par value; authorized shares: 6 billion), issued shares: as of March 31, 2026—3,099,784,716 and as of December 31, 2025—3,099,752,593Noncontrolling interestsAssetsLiabilitiesEquityGross equity (calculated)Treasury stock, at cost: March 31, 2026—1,394,207,761 shares and December 31, 2025— 1,352,205,592 sharesAccumulated other comprehensive income (loss) (AOCI)LiabilitiesLiabilities$2.57 TTotal loans, netTotal loans, net$741.98 BDeposits (including $4,375 and $4,222 as of March 31, 2026 and December 31, 2025, respectively, at fair value)Deposits$1.45 TTrading account assets (including $258,990 and $228,816 pledged to creditors as of March 31, 2026 and December 31, 2025, respectively)Trading account assets$593.47 BAssetsAssets$2.78 TSecurities loaned and sold under agreements to repurchase (including $232,048 and $199,422 as of March 31, 2026 and December 31, 2025, respectively, at fair value)Securities loaned and soldunder agreements to repurchase$369.59 BDeposits with banks, net of allowanceDeposits with banks, net of allowance$362.10 BSecurities borrowed and purchased under agreements to resell (including $189,989 and $206,110 as of March 31, 2026 and December 31, 2025, respectively, at fair value), net of allowanceSecurities borrowed and purchasedunder agreements to resell, net$353.09 BLong-term debt (including $135,058 and $130,726 as of March 31, 2026 and December 31, 2025, respectively, at fair value)Long-term debt$307.57 BTrading account liabilitiesTrading account liabilities$185.27 BAvailable-for-sale debt securities (including $6,286 and $4,931 pledged to creditors as of March 31, 2026 and December 31, 2025, respectively)Available-for-sale debt securities$257.82 BBrokerage payables (including $6,219 and $5,492 as of March 31, 2026 and December 31, 2025, respectively, at fair value)Brokerage payables$111.22 BHeld-to-maturity debt securities, net of allowance (fair value of which is $167,857 and $179,520 as of March 31, 2026 and December 31, 2025, respectively) (includes $98 and $70 pledged to creditors as of March 31, 2026 and December 31, 2025, respectively)Held-to-maturity debt securities, net$178.50 BOther liabilities, plus allowancesOther liabilities, plus allowances$73.18 BOther assets (including $17,652 and $15,840 as of March 31, 2026 and December 31, 2025, respectively, at fair value), net of allowanceOther assets, net$110.66 BShort-term borrowings (including $26,719 and $21,567 as of March 31, 2026 and December 31, 2025, respectively, at fair value)Short-term borrowings$72.06 BBrokerage receivables, net of allowanceBrokerage receivables, net of allowance$91.72 BEquityEquity$212.57 BRetained earningsRetained earnings$219.54 BPremises and equipment, net of depreciation and amortizationPremises and equipment, net$33.57 BGross equity (calculated)Gross equity(calculated)$348.56 BAdditional paid-in capitalAdditional paid-in capital$107.82 BCash and due from banks (including segregated cash and other deposits)Cash and due from banks$23.63 BPreferred stock ($1.00 par value; authorized shares: 30 million), issued shares: as of March 31, 2026—782,000 and as of December 31, 2025—802,000, at aggregate liquidation valueCarrying value$19.55 BGoodwillGoodwill$19.00 BCommon stock ($0.01 par value; authorized shares: 6 billion), issued shares: as of March 31, 2026—3,099,784,716 and as of December 31, 2025—3,099,752,593Common stock$31.00 MEquity securities (including $759 and $921 as of March 31, 2026 and December 31, 2025, respectively, at fair value)Equity securities$7.84 BNoncontrolling interestsNoncontrolling interests$1.61 BIntangible assets (including MSRs of $766 and $759 as of March 31, 2026 and December 31, 2025, respectively)Intangible assets$4.31 BTreasury stock, at cost: March 31, 2026—1,394,207,761 shares and December 31, 2025— 1,352,205,592 sharesTreasury stock−$95.37 BAccumulated other comprehensive income (loss) (AOCI)Accumulated other comprehensiveincome (loss) (AOCI)−$40.62 B
Chart details

Citigroup Inc (C) FY2026 Q1 Balance Sheet

Balance sheet as of 2026-03-31. The chart shows assets, liabilities and equity at that date.

Assets
2,777,687,000,000 US dollars
Liabilities
2,565,115,000,000 US dollars
Equity
212,572,000,000 US dollars
Noncontrolling interest
1,613,000,000 US dollars. Included in consolidated equity; this amount is not added again.
Loans, net of unearned income
761,616,000,000 US dollars. Part of Total loans, net, drawn as one net amount.
Allowance for credit losses on loans (ACLL)
negative 19,636,000,000 US dollars. Part of Total loans, net, drawn as one net amount.
Total loans, net
741,980,000,000 US dollars
Trading account assets (including $258,990 and $228,816 pledged to creditors as of March 31, 2026 and December 31, 2025, respectively)
593,473,000,000 US dollars
Deposits with banks, net of allowance
362,097,000,000 US dollars
Securities borrowed and purchased under agreements to resell (including $189,989 and $206,110 as of March 31, 2026 and December 31, 2025, respectively, at fair value), net of allowance
353,094,000,000 US dollars
Available-for-sale debt securities (including $6,286 and $4,931 pledged to creditors as of March 31, 2026 and December 31, 2025, respectively)
257,822,000,000 US dollars
Held-to-maturity debt securities, net of allowance (fair value of which is $167,857 and $179,520 as of March 31, 2026 and December 31, 2025, respectively) (includes $98 and $70 pledged to creditors as of March 31, 2026 and December 31, 2025, respectively)
178,503,000,000 US dollars
Other assets (including $17,652 and $15,840 as of March 31, 2026 and December 31, 2025, respectively, at fair value), net of allowance
110,658,000,000 US dollars
Brokerage receivables, net of allowance
91,720,000,000 US dollars
Premises and equipment, net of depreciation and amortization
33,574,000,000 US dollars
Cash and due from banks (including segregated cash and other deposits)
23,625,000,000 US dollars
Goodwill
18,997,000,000 US dollars
Equity securities (including $759 and $921 as of March 31, 2026 and December 31, 2025, respectively, at fair value)
7,839,000,000 US dollars
Intangible assets (including MSRs of $766 and $759 as of March 31, 2026 and December 31, 2025, respectively)
4,305,000,000 US dollars
Deposits (including $4,375 and $4,222 as of March 31, 2026 and December 31, 2025, respectively, at fair value)
1,446,240,000,000 US dollars
Securities loaned and sold under agreements to repurchase (including $232,048 and $199,422 as of March 31, 2026 and December 31, 2025, respectively, at fair value)
369,585,000,000 US dollars
Long-term debt (including $135,058 and $130,726 as of March 31, 2026 and December 31, 2025, respectively, at fair value)
307,566,000,000 US dollars
Trading account liabilities
185,266,000,000 US dollars
Brokerage payables (including $6,219 and $5,492 as of March 31, 2026 and December 31, 2025, respectively, at fair value)
111,224,000,000 US dollars
Other liabilities, plus allowances
73,178,000,000 US dollars
Short-term borrowings (including $26,719 and $21,567 as of March 31, 2026 and December 31, 2025, respectively, at fair value)
72,056,000,000 US dollars
Retained earnings
219,542,000,000 US dollars
Additional paid-in capital
107,821,000,000 US dollars
Preferred stock ($1.00 par value; authorized shares: 30 million), issued shares: as of March 31, 2026—782,000 and as of December 31, 2025—802,000, at aggregate liquidation value
19,550,000,000 US dollars
Common stock ($0.01 par value; authorized shares: 6 billion), issued shares: as of March 31, 2026—3,099,784,716 and as of December 31, 2025—3,099,752,593
31,000,000 US dollars
Noncontrolling interests
1,613,000,000 US dollars
Treasury stock, at cost: March 31, 2026—1,394,207,761 shares and December 31, 2025— 1,352,205,592 shares
negative 95,370,000,000 US dollars
Accumulated other comprehensive income (loss) (AOCI)
negative 40,615,000,000 US dollars
Gross equity (calculated)
348,557,000,000 US dollars. Net equity plus the magnitudes of its negative contributions equals gross positive equity. The negative contributions enter this reconciliation as add-backs; their filed signs stay negative.

Chart connections

  • Assets equal liabilities plus consolidated equity. Consolidated equity includes noncontrolling interests when reported.
  • Treasury shares and other negative equity contributions reduce equity.
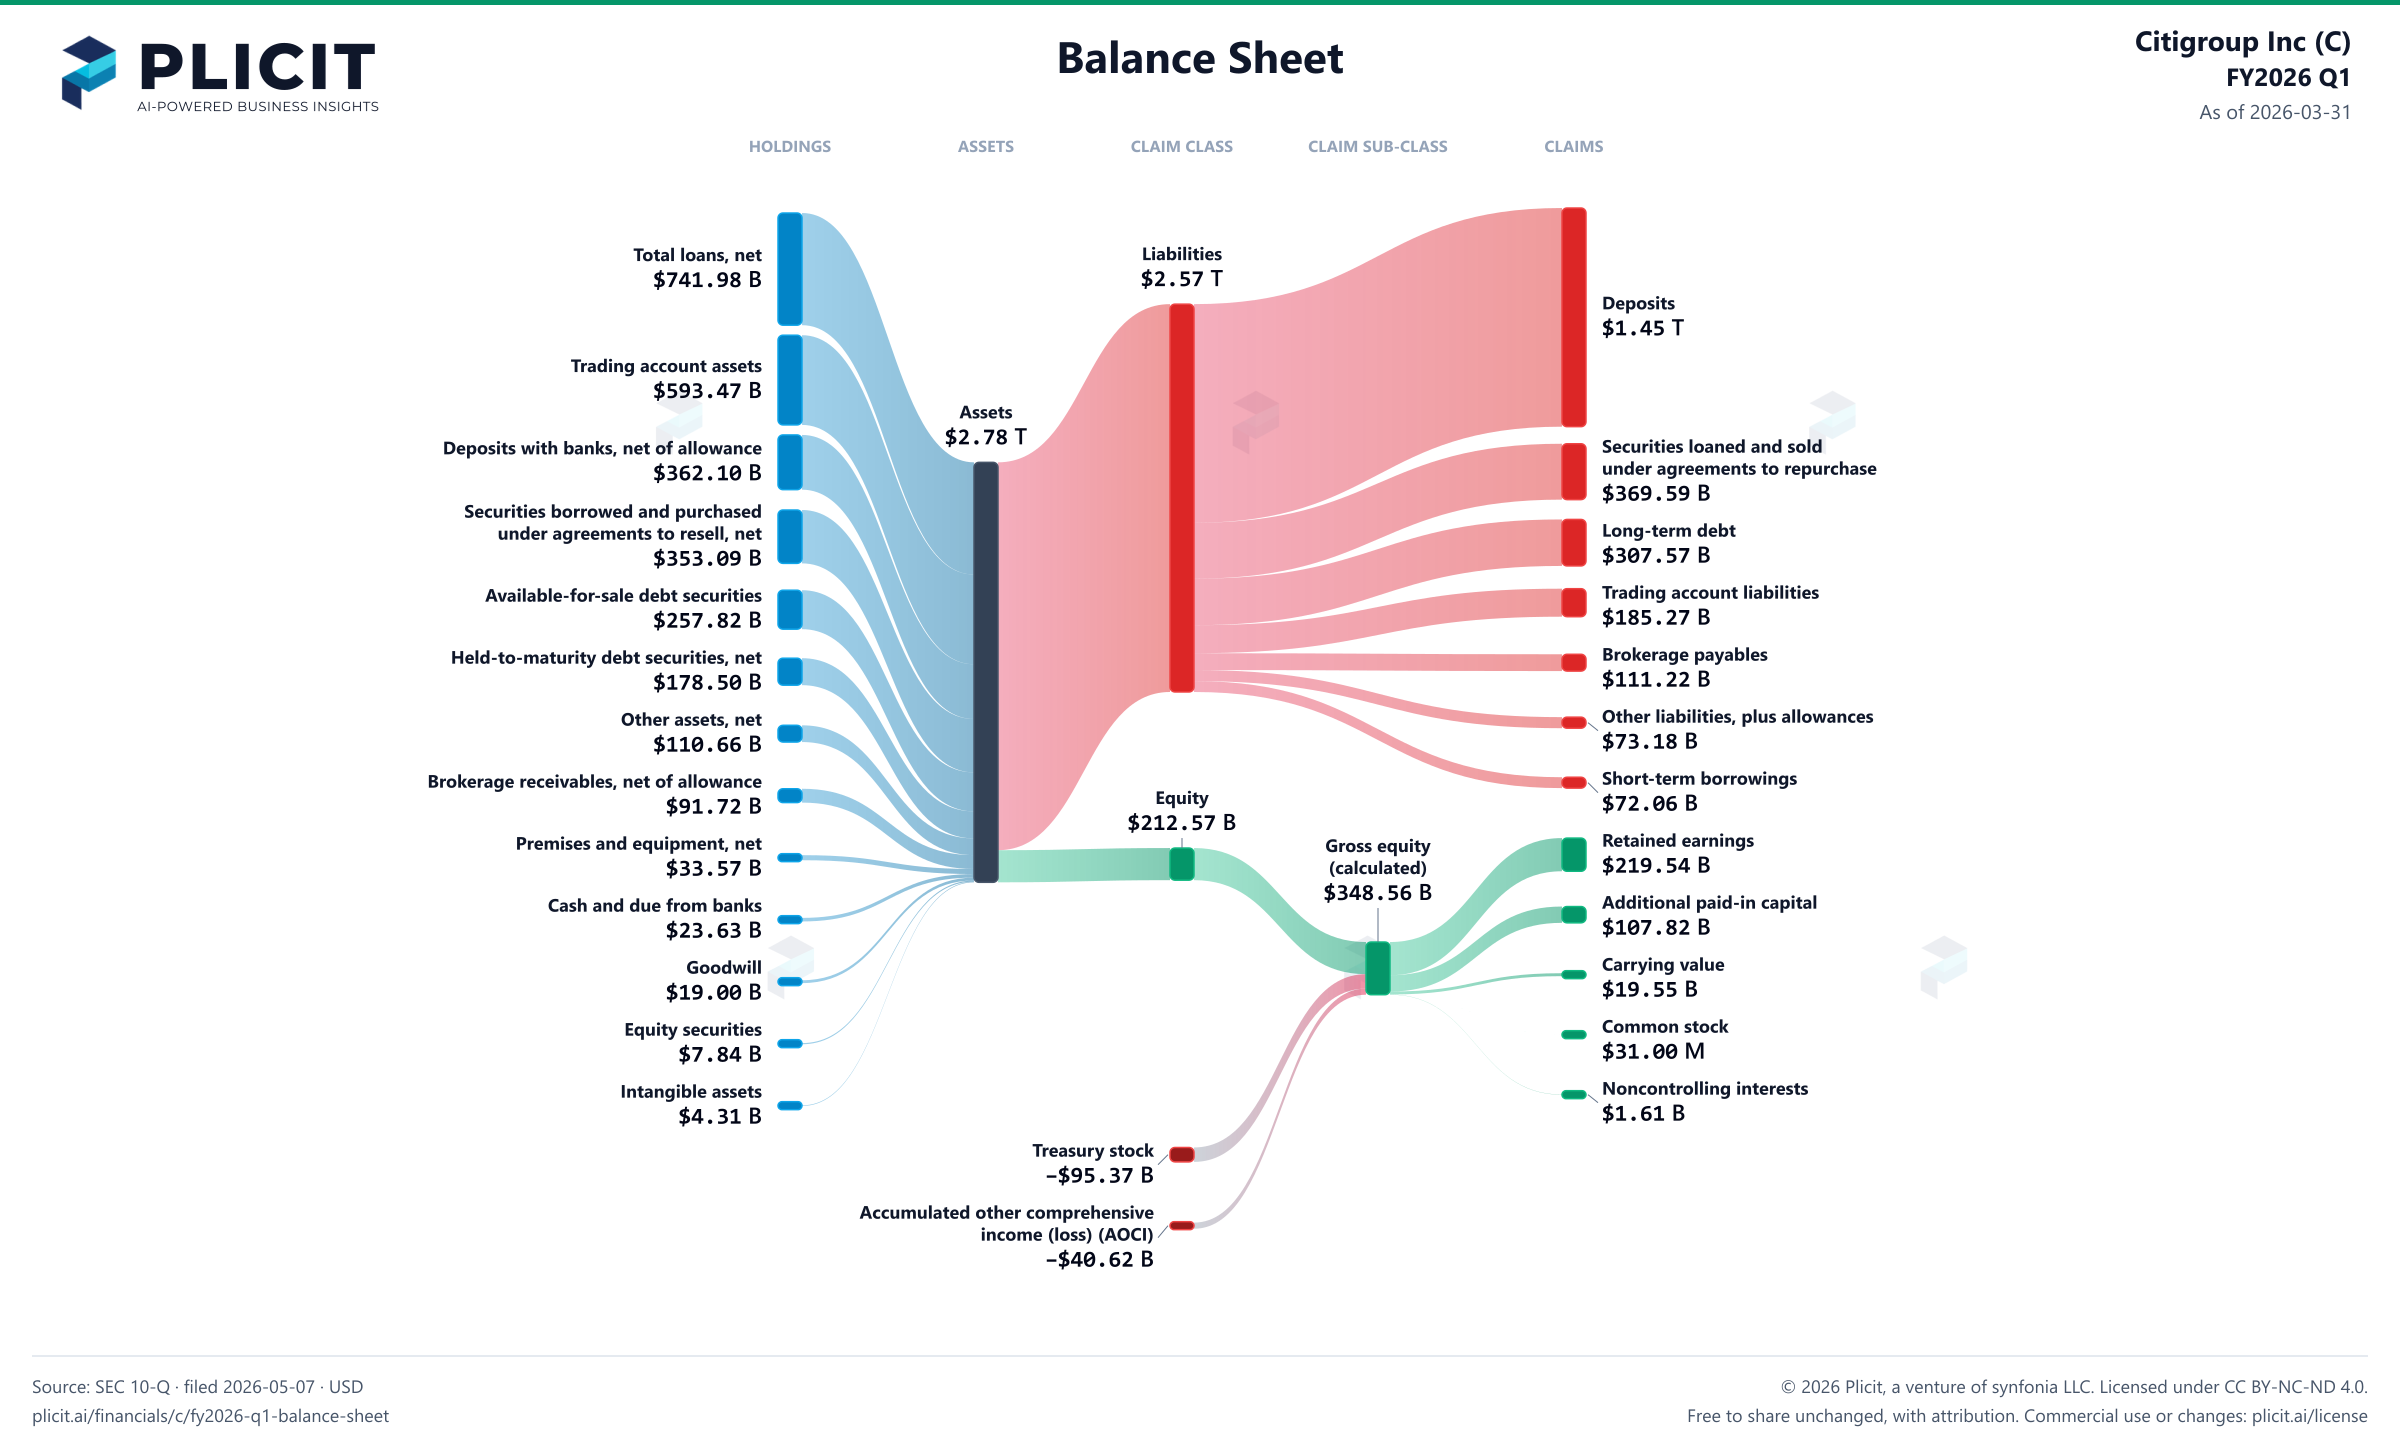
Citigroup Inc (C) FY2026 Q1 Balance Sheet Sankey chart
Free to share unchanged, with credit to Plicit.ai · CC BY-NC-ND 4.0Download PNG

Newsletter

Get the teardowns by email

Subscribe if you want the public-company teardowns in your inbox when they're released.

Product waitlist

Health Check and Teardown for your own company

A health check uncovers insights of your private books, not a public ticker. Join this list to get notified as soon as we go-live!