
Cboe Global Markets, Inc. (CBOE) FY2026 Q2 Balance Sheet

Balance Sheet

As of 2026-06-30

Swipe to see the full flow
Cboe Global Markets, Inc. (CBOE) FY2026 Q2 Balance SheetBalance sheet as of 2026-06-30. The chart shows assets, liabilities and equity at that date.Current liabilities$3.79 BCurrent assets$5.93 BLiabilities$4.98 BAssets$10.61 BNon-current liabilities$1.20 BEquity$5.63 BNon-current assets$4.68 BGross equity(calculated)$5.74 BHOLDINGSASSET CLASSASSETSCLAIM CLASSCLAIM SUB-CLASSCLAIMSMargin deposits, default fund, and interoperability fundCash and cash equivalentsAccounts receivable, net of $5.4 allowance for credit losses at June 30, 2026 and $6.8 at December 31, 2025Assets held for saleFinancial investmentsOther current assets (includes restricted cash of $28.4 at June 30, 2026 and $34.1 at December 31, 2025)Income taxes receivableGoodwillIntangible assets, netOther assets, netProperty and equipment, netOperating lease right of use assetsInvestmentsMargin deposits, default fund, and interoperability fundCurrent portion of long-term debtAccounts payable and accrued liabilitiesSection 31 fees payableLiabilities held for saleDeferred revenueIncome taxes payableLong-term debtDeferred income taxesNon-current operating lease liabilitiesOther non-current liabilitiesNon-current unrecognized tax benefitsRetained earningsAdditional paid-in capitalAccumulated other comprehensive income, netCommon stock, $0.01 par value: 325,000,000 shares authorized, 104,944,263 and 104,554,843 shares issued and outstanding, respectively at June 30, 2026 and 104,654,764 and 104,647,739 shares issued and outstanding, respectively at December 31, 2025Current assetsNon-current assetsAssetsCurrent liabilitiesNon-current liabilitiesLiabilitiesEquityGross equity (calculated)Common stock in treasury, at cost: 389,420 shares at June 30, 2026 and 7,025 shares at December 31, 2025Margin deposits, default fund, and interoperability fundMargin deposits, default fund, and interoperability fund$2.54 BCurrent liabilitiesCurrent liabilities$3.79 BCurrent portion of long-term debtCurrent portion of long-term debt$649.60 MMargin deposits, default fund, and interoperability fundMargin deposits, default fund, and interoperability fund$2.54 BCurrent assetsCurrent assets$5.93 BAccounts payable and accrued liabilitiesAccounts payable and accrued liabilities$389.10 MSection 31 fees payableSection 31 fees payable$155.50 MCash and cash equivalentsCash and cash equivalents$2.28 BLiabilitiesLiabilities$4.98 BLiabilities held for saleLiabilities held for sale$31.70 MAssetsAssets$10.61 BAccounts receivable, net of $5.4 allowance for credit losses at June 30, 2026 and $6.8 at December 31, 2025Accounts receivable, net$570.60 MDeferred revenueDeferred revenue$13.00 MAssets held for saleAssets held for sale$261.00 MIncome taxes payableIncome taxes payable$5.30 MFinancial investmentsFinancial investments$114.50 MLong-term debtLong-term debt$794.20 MOther current assets (includes restricted cash of $28.4 at June 30, 2026 and $34.1 at December 31, 2025)Other current assets$85.30 MNon-current liabilitiesNon-current liabilities$1.20 BDeferred income taxesDeferred income taxes$224.70 MIncome taxes receivableIncome taxes receivable$76.90 MEquityEquity$5.63 BNon-current operating lease liabilitiesNon-current operating lease liabilities$111.50 MOther non-current liabilitiesOther non-current liabilities$43.20 MGoodwillGoodwill$3.05 BNon-current assetsNon-current assets$4.68 BNon-current unrecognized tax benefitsNon-current unrecognized tax benefits$23.40 MGross equity (calculated)Gross equity(calculated)$5.74 BIntangible assets, netIntangible assets, net$1.18 BOther assets, netOther assets, net$172.00 MRetained earningsRetained earnings$4.13 BProperty and equipment, netProperty and equipment, net$136.70 MOperating lease right of use assetsOperating lease right of use assets$101.60 MAdditional paid-in capitalAdditional paid-in capital$1.60 BInvestmentsInvestments$40.60 MAccumulated other comprehensive income, netAccumulated other comprehensive income, net$4.70 MCommon stock, $0.01 par value: 325,000,000 shares authorized, 104,944,263 and 104,554,843 shares issued and outstanding, respectively at June 30, 2026 and 104,654,764 and 104,647,739 shares issued and outstanding, respectively at December 31, 2025Common stock$1.00 MCommon stock in treasury, at cost: 389,420 shares at June 30, 2026 and 7,025 shares at December 31, 2025Common stock in treasury−$109.40 M
Chart details

Cboe Global Markets, Inc. (CBOE) FY2026 Q2 Balance Sheet

Balance sheet as of 2026-06-30. The chart shows assets, liabilities and equity at that date.

Assets
10,609,300,000 US dollars
Current assets
5,926,800,000 US dollars
Non-current assets
4,682,500,000 US dollars
Liabilities
4,983,500,000 US dollars
Current liabilities
3,786,500,000 US dollars
Non-current liabilities
1,197,000,000 US dollars
Equity
5,625,800,000 US dollars
Margin deposits, default fund, and interoperability fund
2,542,300,000 US dollars
Cash and cash equivalents
2,276,200,000 US dollars
Accounts receivable, net of $5.4 allowance for credit losses at June 30, 2026 and $6.8 at December 31, 2025
570,600,000 US dollars
Assets held for sale
261,000,000 US dollars
Financial investments
114,500,000 US dollars
Other current assets (includes restricted cash of $28.4 at June 30, 2026 and $34.1 at December 31, 2025)
85,300,000 US dollars
Income taxes receivable
76,900,000 US dollars
Goodwill
3,047,600,000 US dollars
Intangible assets, net
1,184,000,000 US dollars
Other assets, net
172,000,000 US dollars
Property and equipment, net
136,700,000 US dollars
Operating lease right of use assets
101,600,000 US dollars
Investments
40,600,000 US dollars
Margin deposits, default fund, and interoperability fund
2,542,300,000 US dollars
Current portion of long-term debt
649,600,000 US dollars
Accounts payable and accrued liabilities
389,100,000 US dollars
Section 31 fees payable
155,500,000 US dollars
Liabilities held for sale
31,700,000 US dollars
Deferred revenue
13,000,000 US dollars
Income taxes payable
5,300,000 US dollars
Long-term debt
794,200,000 US dollars
Deferred income taxes
224,700,000 US dollars
Non-current operating lease liabilities
111,500,000 US dollars
Other non-current liabilities
43,200,000 US dollars
Non-current unrecognized tax benefits
23,400,000 US dollars
Retained earnings
4,131,000,000 US dollars
Additional paid-in capital
1,598,500,000 US dollars
Accumulated other comprehensive income, net
4,700,000 US dollars
Common stock, $0.01 par value: 325,000,000 shares authorized, 104,944,263 and 104,554,843 shares issued and outstanding, respectively at June 30, 2026 and 104,654,764 and 104,647,739 shares issued and outstanding, respectively at December 31, 2025
1,000,000 US dollars
Preferred stock, $0.01 par value: 20,000,000 shares authorized, no shares issued and outstanding at June 30, 2026 and December 31, 2025
0 US dollars
Common stock in treasury, at cost: 389,420 shares at June 30, 2026 and 7,025 shares at December 31, 2025
negative 109,400,000 US dollars
Gross equity (calculated)
5,735,200,000 US dollars. Net equity plus the magnitudes of its negative contributions equals gross positive equity. The negative contributions enter this reconciliation as add-backs; their filed signs stay negative.

Chart connections

  • Assets equal liabilities plus consolidated equity. Consolidated equity includes noncontrolling interests when reported.
  • Treasury shares and other negative equity contributions reduce equity.
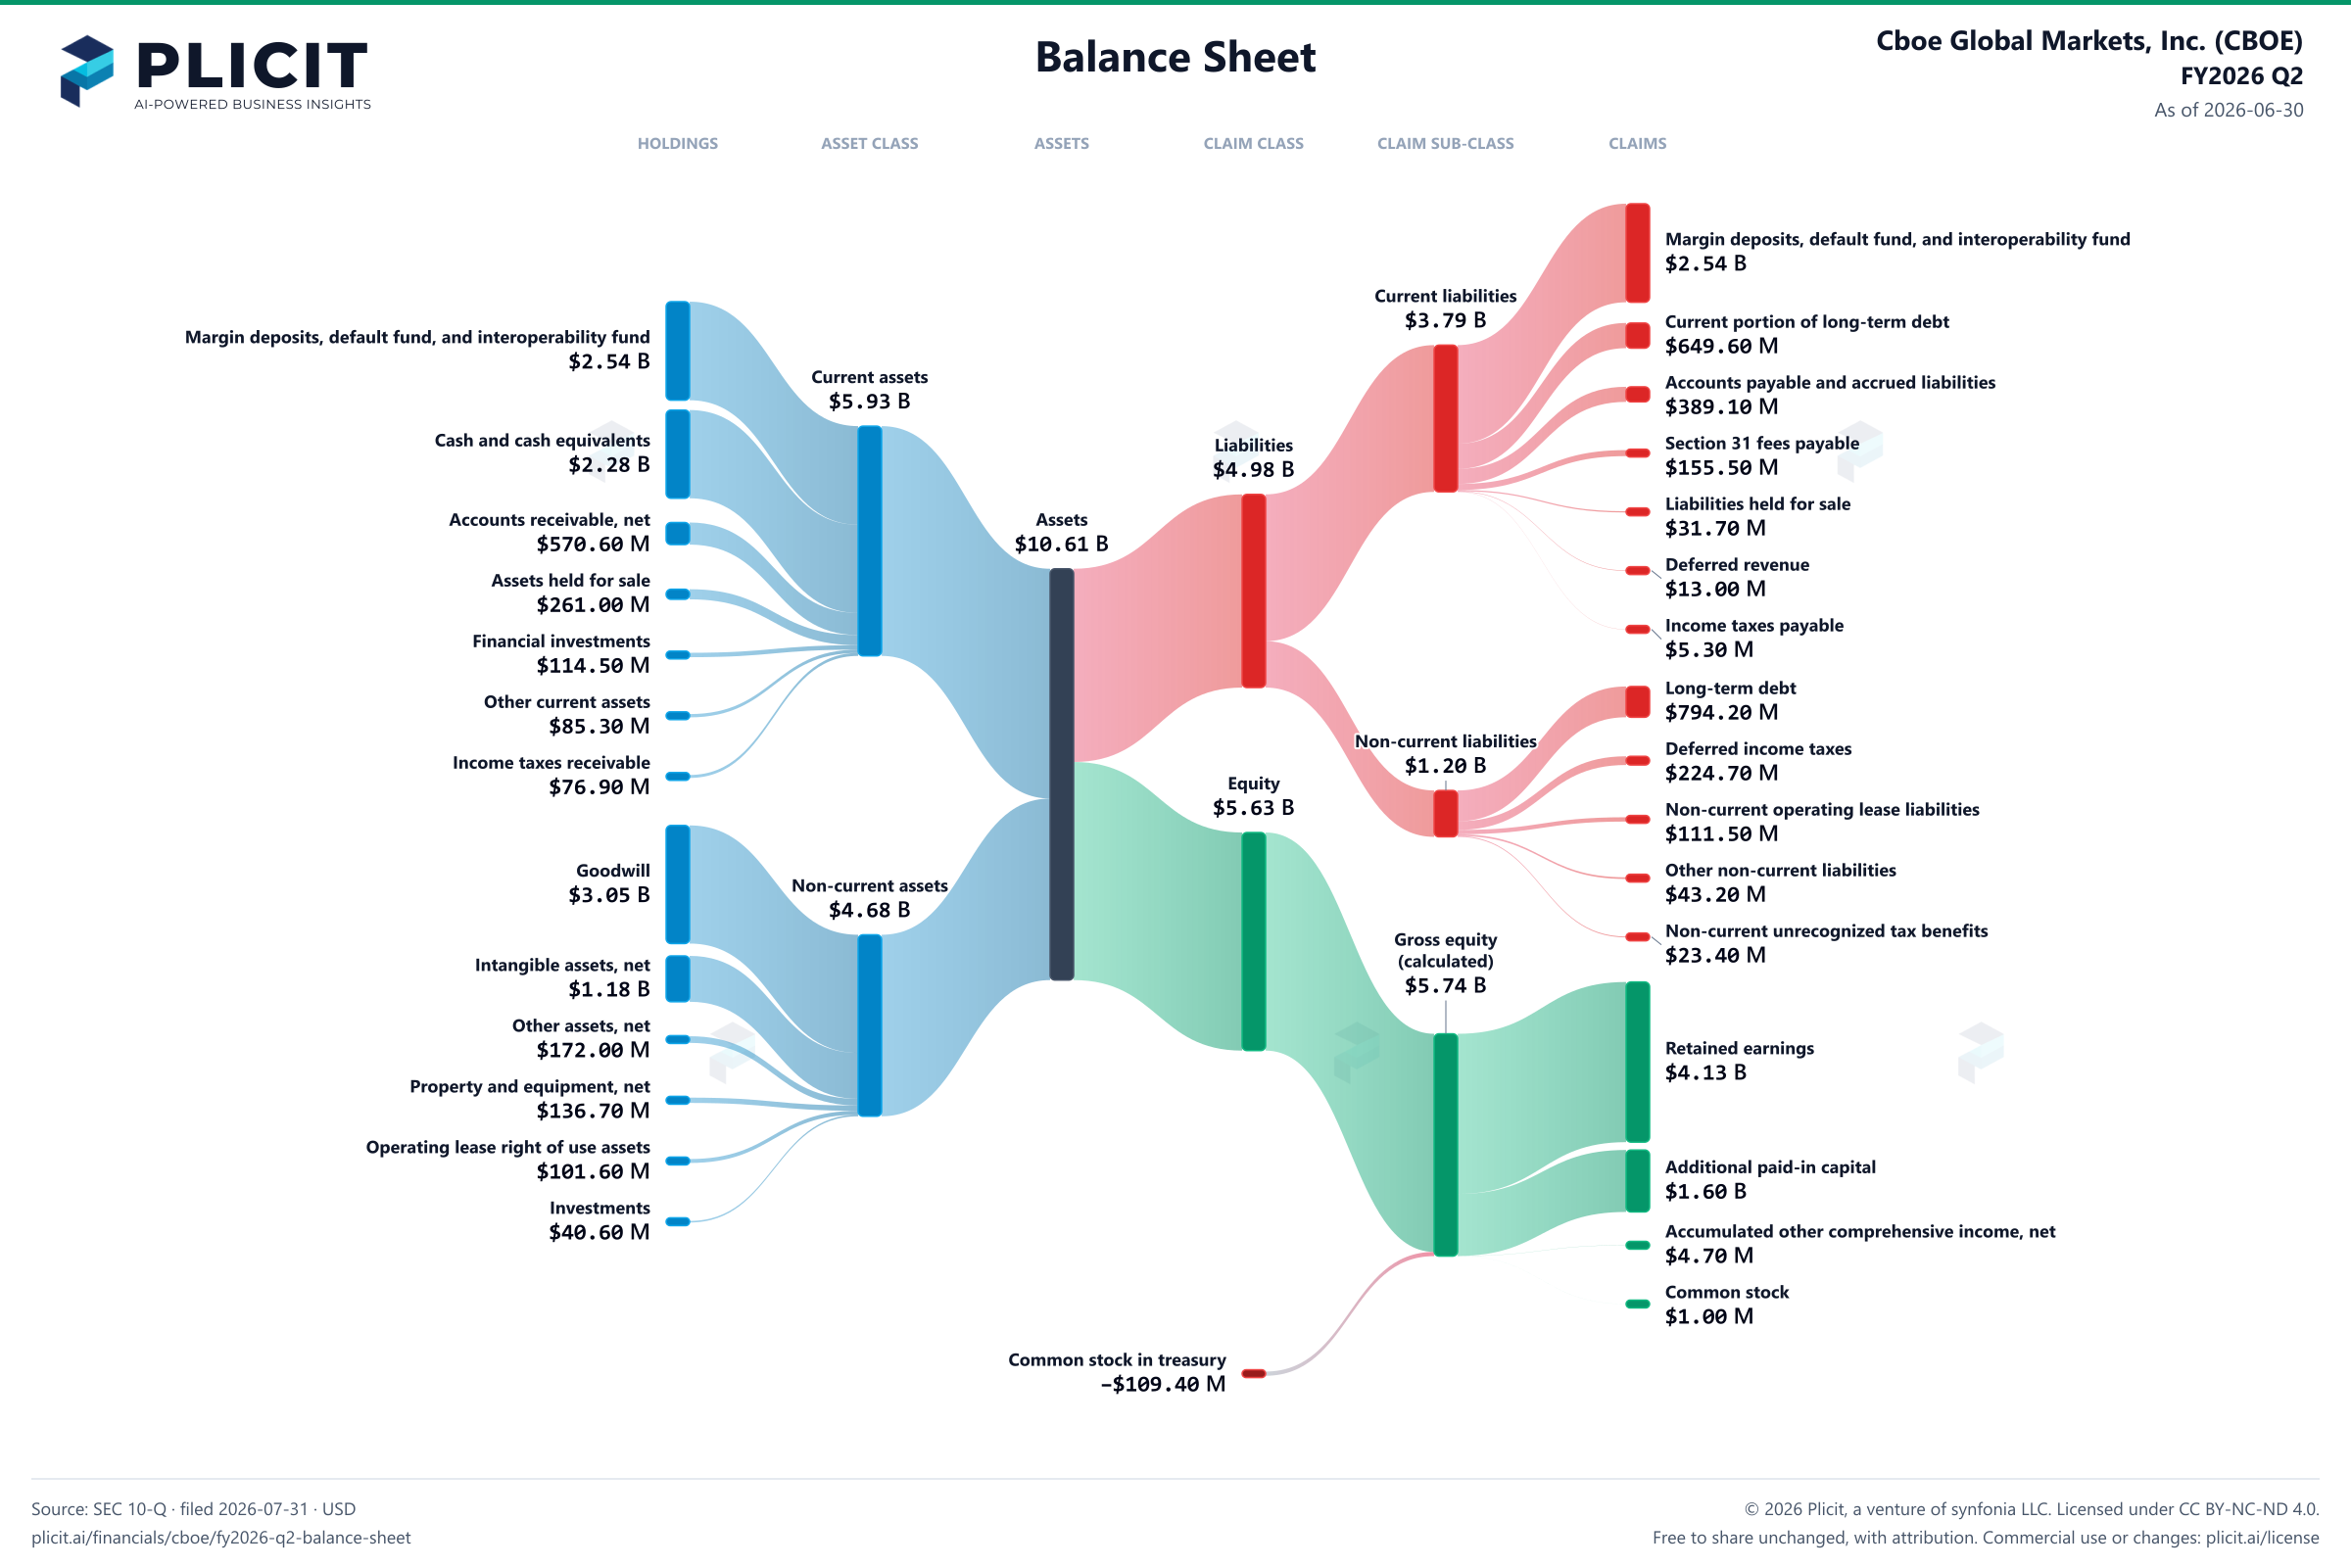
Cboe Global Markets, Inc. (CBOE) FY2026 Q2 Balance Sheet Sankey chart
Free to share unchanged, with credit to Plicit.ai · CC BY-NC-ND 4.0Download PNG

Newsletter

Get the teardowns by email

Subscribe if you want the public-company teardowns in your inbox when they're released.

Product waitlist

Health Check and Teardown for your own company

A health check uncovers insights of your private books, not a public ticker. Join this list to get notified as soon as we go-live!