
CHOICE HOTELS INTERNATIONAL INC /DE (CHH) FY2026 Q2 P&L / Income Statement

Revenue by Product and Service

2026-04-01 to 2026-06-30

Swipe to see the full flow
CHOICE HOTELS INTERNATIONAL INC /DE (CHH) FY2026 Q2 P&L / Income StatementIncome statement for 2026-04-01 through 2026-06-30. View: Product and service. Revenue and costs use their disclosed categories.SOURCESREVENUEGROSSOPERATINGPRE-TAXNETFranchise and management feesRevenue for reimbursable costs from franchised and managed properties revenueOwned hotels revenuePartnership services and feesOtherTotal revenuesGross profit (calculated)Cost of revenue (calculated)Revenue for reimbursable costs from franchised and managed properties cost of revenueOwned hotels cost of revenueOperating incomeOperating expenses (calculated)Selling, general and administrativeDepreciation and amortizationBusiness combination, diligence and transition costsIncome before income taxesTotal other expenses and (income), netNet incomeIncome tax expenseGross profit (calculated)Gross profit(calculated)$217.64 MTotal revenuesTotal revenues$440.76 MOperating incomeOperating income$104.14 MIncome before income taxesPretax income$85.88 MNet incomeNet income$64.34 MFranchise and management feesFranchise and management fees$187.54 MOperating expenses (calculated)Operating expenses(calculated)$113.50 MIncome tax expenseIncome tax expense$21.54 MTotal other expenses and (income), netTotal other expensesand (income), net−$18.26 MSelling, general and administrativeSelling, general and administrative$96.15 MCost of revenue (calculated)Cost of revenue(calculated)$223.12 MRevenue for reimbursable costs from franchised and managed properties revenueRevenue for reimbursable costs fromfranchised and managed properties$163.32 MDepreciation and amortizationDepreciation and amortization$16.81 MOwned hotels revenueOwned hotels$34.90 MBusiness combination, diligence and transition costsBusiness combination,diligence and transition costs$536.00 KRevenue for reimbursable costs from franchised and managed properties cost of revenueRevenue forreimbursable costsfrom franchised and…$197.67 MPartnership services and feesPartnership services and fees$28.67 MOtherOther$26.33 MOwned hotels cost of revenueOwned hotels$25.46 M
Chart details

CHOICE HOTELS INTERNATIONAL INC /DE (CHH) FY2026 Q2 P&L / Income Statement

Income statement for 2026-04-01 through 2026-06-30. View: Product and service. Revenue and costs use their disclosed categories.

Total revenues
440,762,000 US dollars
Cost of revenue (calculated)
223,122,000 US dollars
Gross profit (calculated)
217,640,000 US dollars
Operating expenses (calculated)
113,502,000 US dollars
Operating income
104,138,000 US dollars
Total other expenses and (income), net
negative 18,256,000 US dollars
Income before income taxes
85,882,000 US dollars
Income tax expense
21,544,000 US dollars
Net income
64,338,000 US dollars
Franchise and management fees
187,536,000 US dollars
Partnership services and fees
28,674,000 US dollars
Owned hotels revenue
34,896,000 US dollars
Other
26,332,000 US dollars
Revenue for reimbursable costs from franchised and managed properties revenue
163,324,000 US dollars
Owned hotels cost of revenue
25,457,000 US dollars
Revenue for reimbursable costs from franchised and managed properties cost of revenue
197,665,000 US dollars
Selling, general and administrative
96,153,000 US dollars
Business combination, diligence and transition costs
536,000 US dollars
Depreciation and amortization
16,813,000 US dollars

Chart connections

  • Revenue less cost of revenue equals gross profit; gross profit less operating expenses equals operating income.
  • Operating income plus other income or expense equals income before tax. Income before tax less income tax expense or benefit equals net income.
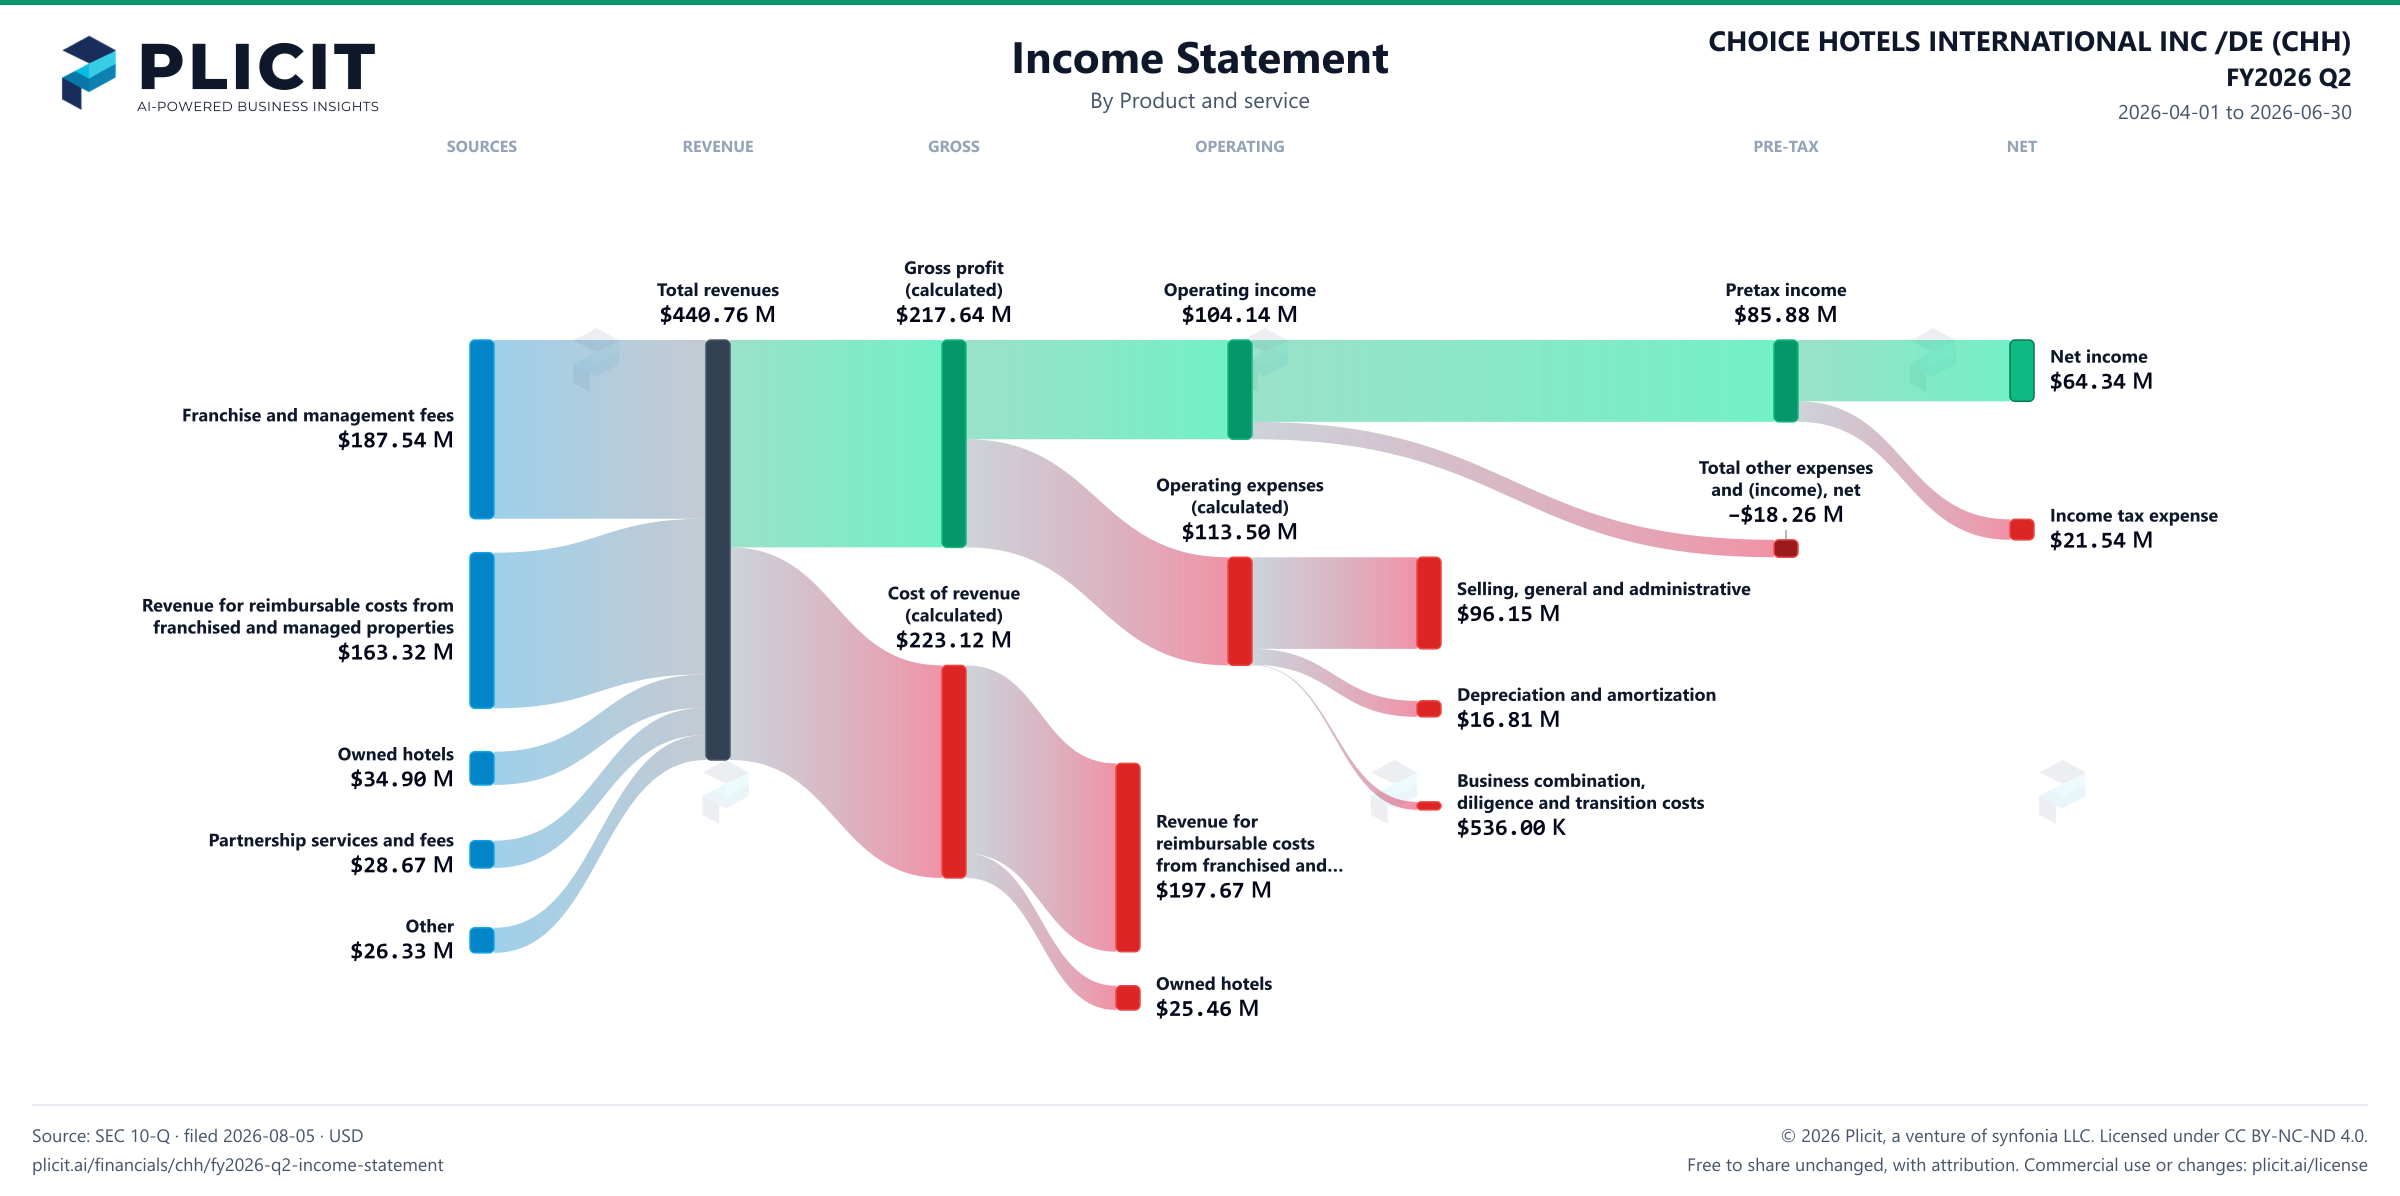
CHOICE HOTELS INTERNATIONAL INC /DE (CHH) FY2026 Q2 P&L / Income Statement Sankey chart
Free to share unchanged, with credit to Plicit.ai · CC BY-NC-ND 4.0Download PNG

Gross margin

49.4%

Gross profit / revenue

Operating margin

23.6%

Operating profit / revenue

Cash conversion

140.7%

Operating cash / net income, same period

Newsletter

Get the teardowns by email

Subscribe if you want the public-company teardowns in your inbox when they're released.

Product waitlist

Health Check and Teardown for your own company

A health check uncovers insights of your private books, not a public ticker. Join this list to get notified as soon as we go-live!