
The Cigna Group (CI) FY2024 Annual Balance Sheet
As of 2024-12-31
Balance Sheet
As of 2024-12-31
Swipe to see the full flow
Chart details
The Cigna Group (CI) FY2024 Annual Balance Sheet
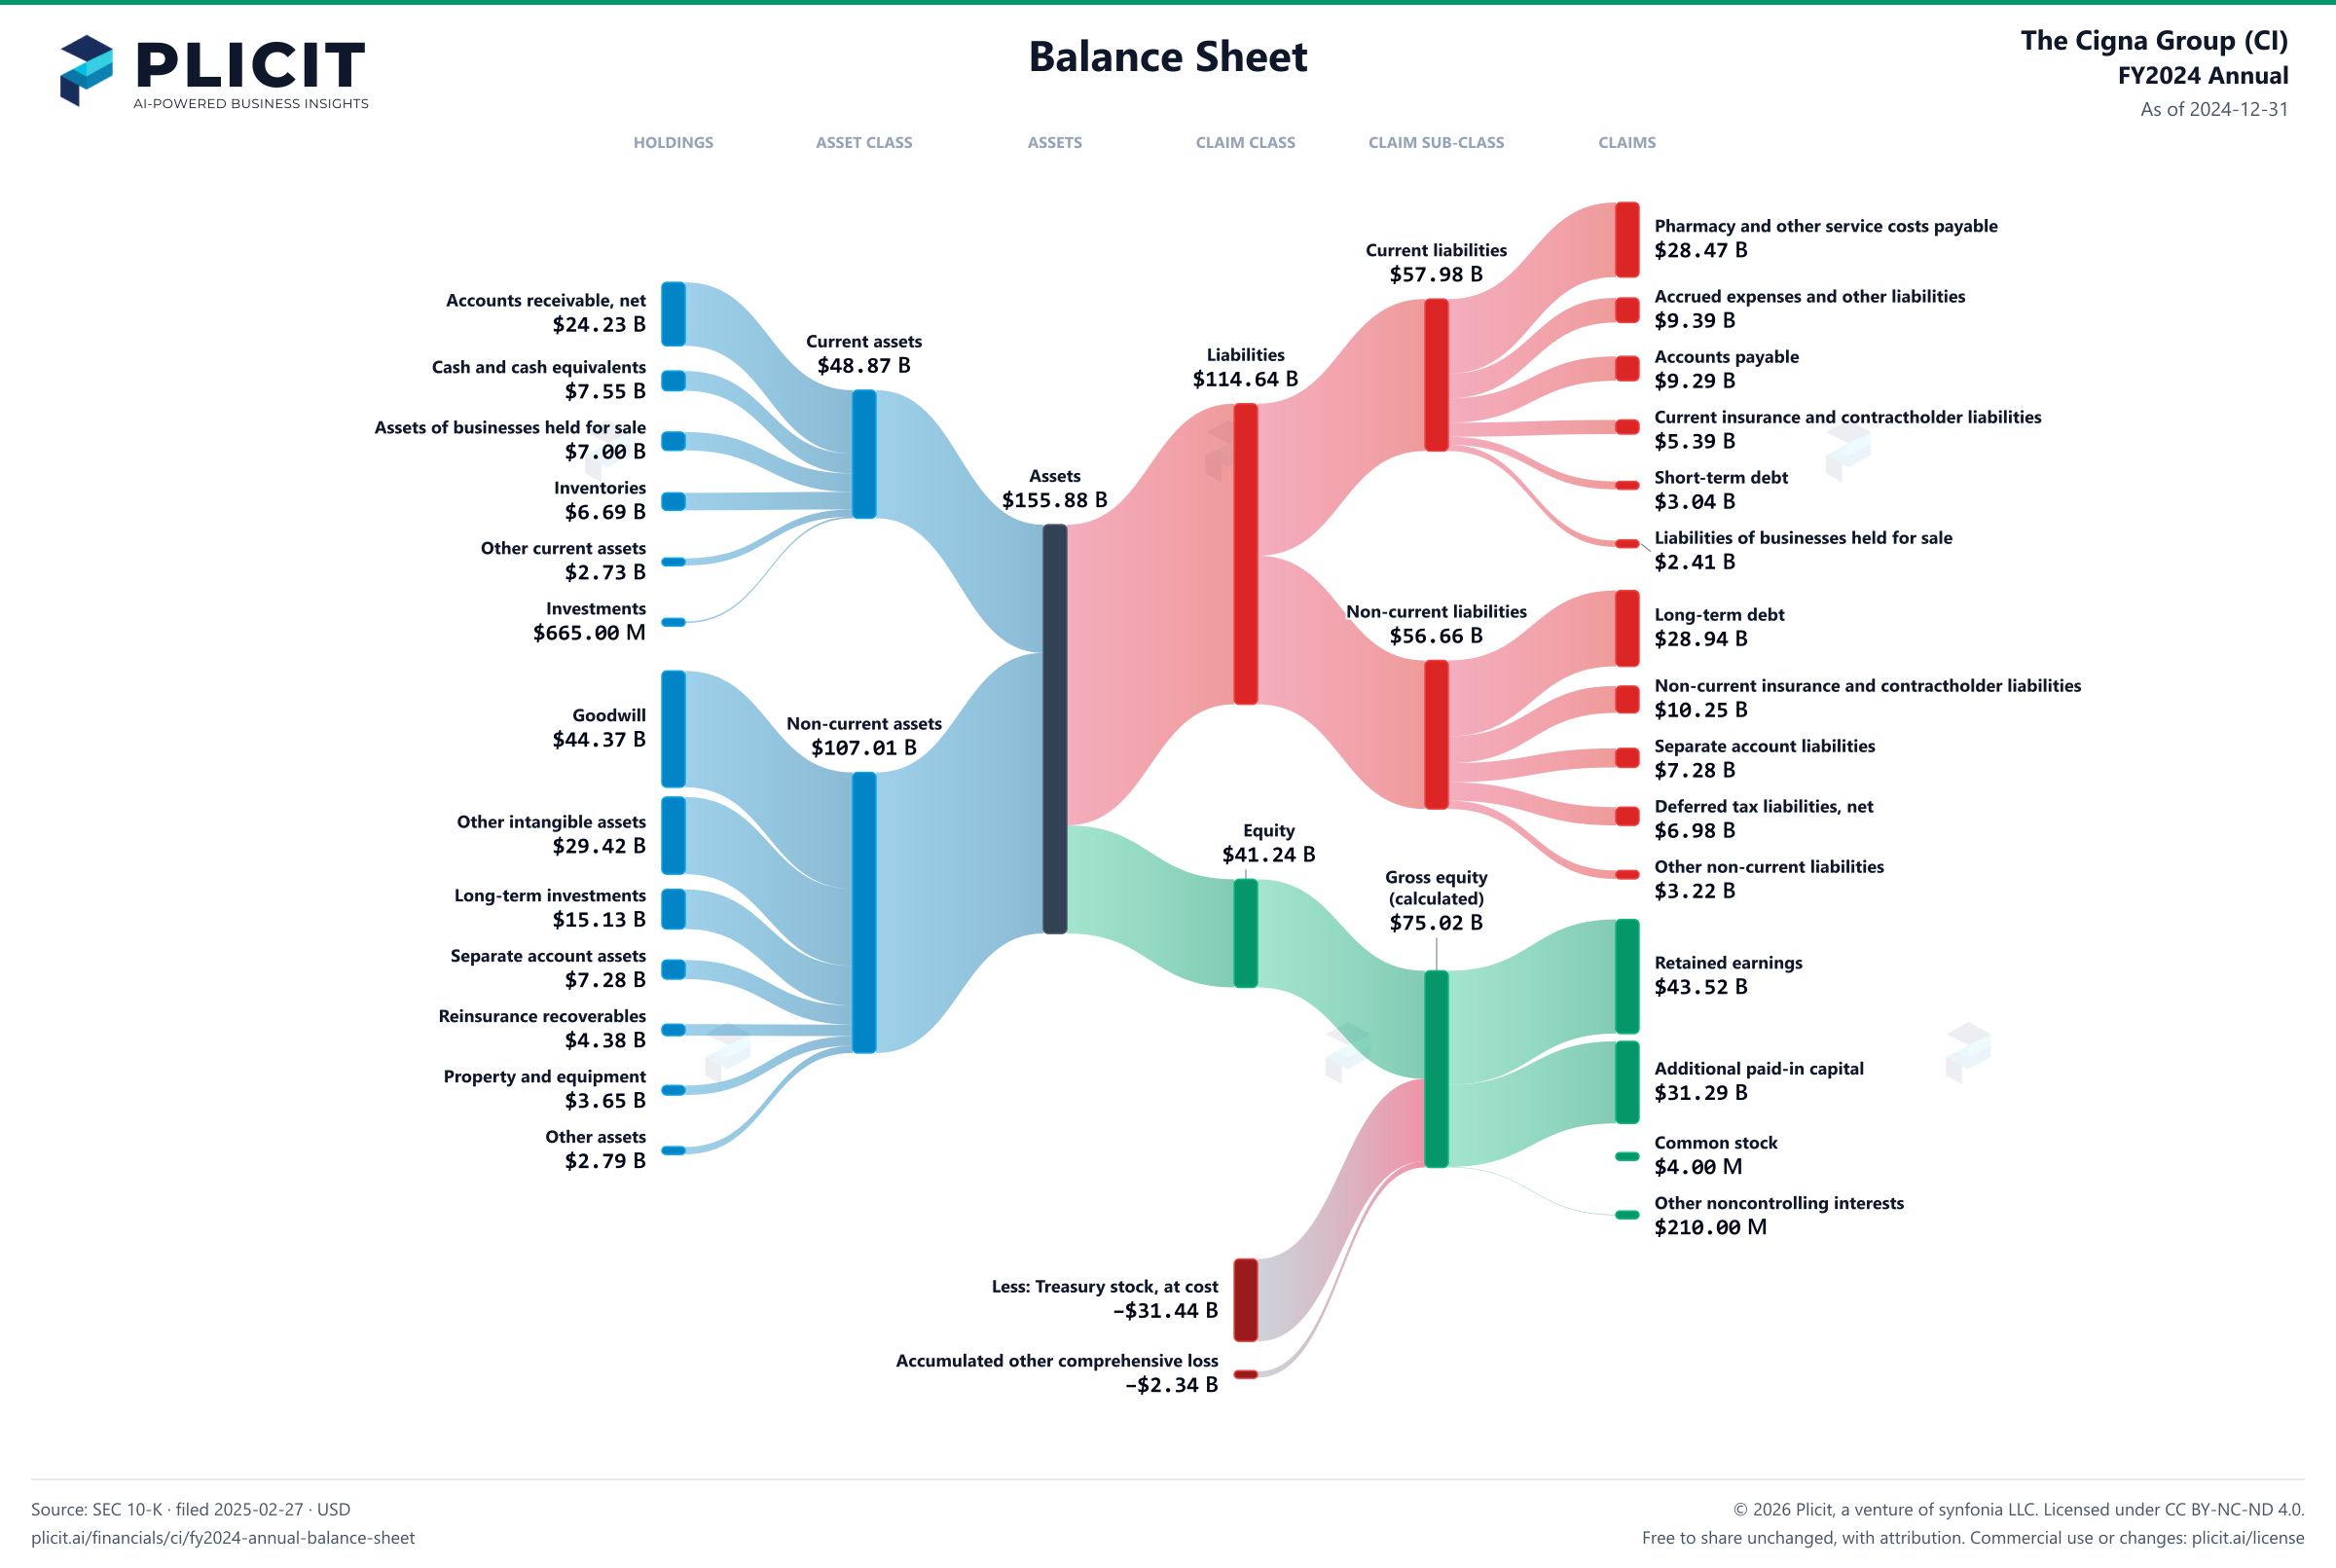
Balance sheet as of 2024-12-31. The chart shows assets, liabilities and equity at that date.
- Assets
- 155,881,000,000 US dollars
- Current assets
- 48,870,000,000 US dollars
- Non-current assets
- 107,011,000,000 US dollars
- Liabilities
- 114,638,000,000 US dollars
- Current liabilities
- 57,979,000,000 US dollars
- Non-current liabilities
- 56,659,000,000 US dollars
- Equity
- 41,243,000,000 US dollars
- Redeemable noncontrolling interests
- 0 US dollars
- Noncontrolling interest
- 210,000,000 US dollars. Included in consolidated equity; this amount is not added again.
- Accounts receivable, net
- 24,227,000,000 US dollars
- Cash and cash equivalents
- 7,550,000,000 US dollars
- Assets of businesses held for sale
- 7,004,000,000 US dollars
- Inventories
- 6,692,000,000 US dollars
- Other current assets
- 2,732,000,000 US dollars
- Investments
- 665,000,000 US dollars
- Goodwill
- 44,370,000,000 US dollars
- Other intangible assets
- 29,417,000,000 US dollars
- Long-term investments
- 15,128,000,000 US dollars
- Separate account assets
- 7,278,000,000 US dollars
- Reinsurance recoverables
- 4,378,000,000 US dollars
- Property and equipment
- 3,654,000,000 US dollars
- Other assets
- 2,786,000,000 US dollars
- Assets of businesses held for sale, non-current
- 0 US dollars
- Pharmacy and other service costs payable
- 28,465,000,000 US dollars
- Accrued expenses and other liabilities
- 9,387,000,000 US dollars
- Accounts payable
- 9,294,000,000 US dollars
- Current insurance and contractholder liabilities
- 5,388,000,000 US dollars
- Short-term debt
- 3,035,000,000 US dollars
- Liabilities of businesses held for sale
- 2,410,000,000 US dollars
- Long-term debt
- 28,937,000,000 US dollars
- Non-current insurance and contractholder liabilities
- 10,254,000,000 US dollars
- Separate account liabilities
- 7,278,000,000 US dollars
- Deferred tax liabilities, net
- 6,975,000,000 US dollars
- Other non-current liabilities
- 3,215,000,000 US dollars
- Liabilities of businesses held for sale, non-current
- 0 US dollars
- Retained earnings
- 43,519,000,000 US dollars
- Additional paid-in capital
- 31,288,000,000 US dollars
- Common stock
- 4,000,000 US dollars
- Other noncontrolling interests
- 210,000,000 US dollars
- Less: Treasury stock, at cost
- negative 31,437,000,000 US dollars
- Accumulated other comprehensive loss
- negative 2,341,000,000 US dollars
- Gross equity (calculated)
- 75,021,000,000 US dollars. Net equity plus the magnitudes of its negative contributions equals gross positive equity. The negative contributions enter this reconciliation as add-backs; their filed signs stay negative.
Chart connections
- Assets equal liabilities plus temporary equity plus consolidated equity. Consolidated equity includes noncontrolling interests when reported.
- Treasury shares and other negative equity contributions reduce equity.
Free to share unchanged, with credit to Plicit.ai · CC BY-NC-ND 4.0Download PNG
Product waitlist
Health Check and Teardown for your own company
A health check uncovers insights of your private books, not a public ticker. Join this list to get notified as soon as we go-live!