
Ciena Corp (CIEN) FY2025 Annual P&L / Income Statement

2024-11-03 to 2025-11-01

Swipe to see the full flow
Ciena Corp (CIEN) FY2025 Annual P&L / Income StatementIncome statement for 2024-11-03 through 2025-11-01. View: Segments by Timing of Transfer of Good or Service. Revenue uses this breakdown; costs and expenses retain the consolidated categories.SOURCESREVENUEGROSSOPERATINGPRE-TAXNETNetworking Platforms - Products and services at a point in timeGlobal Services - Products and services transferred over timePlatform Software and Services - Products and services transferred over timePlatform Software and Services - Products and services at a point in timeBlue Planet Automation Software and Services - Products and services transferred over timeBlue Planet Automation Software and Services - Products and services at a point in timeGlobal Services - Products and services at a point in timeTotal revenueGross profitTotal cost of goods soldIncome from operationsTotal operating expensesResearch and developmentSelling and marketingGeneral and administrativeSignificant asset impairments and restructuring costsAmortization of intangible assetsAcquisition and integration costsIncome before income taxesOther income (expense), net (calculated)Net incomeProvision for income taxesTotal revenueTotal revenue$4.77 BGross profitGross profit$2.00 BIncome from operationsIncome from operations$197.53 MIncome before income taxesPretax income$156.29 MNet incomeNet income$123.34 MTotal operating expensesTotal operatingexpenses$1.81 BProvision for income taxesProvision forincome taxes$32.95 MNetworking Platforms - Products and services at a point in timeNetworking Platforms - Productsand services at a point in time$3.68 BResearch and developmentResearch and development$848.33 MOther income (expense), net (calculated)Other income,net (calculated)−$41.24 MTotal cost of goods soldTotal cost ofgoods sold$2.76 BSelling and marketingSelling and marketing$581.33 MGeneral and administrativeGeneral and administrative$238.71 MGlobal Services - Products and services transferred over timeGlobal Services - Products andservices transferred over time$565.17 MSignificant asset impairments and restructuring costsSignificant asset impairmentsand restructuring costs$112.11 MPlatform Software and Services - Products and services transferred over timePlatform Software andServices - Products andservices transferred over time$259.92 MAmortization of intangible assetsAmortization of intangible assets$25.76 MPlatform Software and Services - Products and services at a point in timePlatform Software andServices - Products andservices at a point in time$103.91 MAcquisition and integration costsAcquisition and integration costs$1.15 MBlue Planet Automation Software and Services - Products and services transferred over timeBlue Planet Automation Softwareand Services - Products andservices transferred over time$66.15 MBlue Planet Automation Software and Services - Products and services at a point in timeBlue Planet Automation Softwareand Services - Products andservices at a point in time$49.40 MGlobal Services - Products and services at a point in timeGlobal Services - Productsand services at a point in time$48.58 M
Chart details

Ciena Corp (CIEN) FY2025 Annual P&L / Income Statement

Income statement for 2024-11-03 through 2025-11-01. View: Segments by Timing of Transfer of Good or Service. Revenue uses this breakdown; costs and expenses retain the consolidated categories.

Total revenue
4,769,507,000 US dollars
Total cost of goods sold
2,764,590,000 US dollars
Gross profit
2,004,917,000 US dollars
Total operating expenses
1,807,386,000 US dollars
Income from operations
197,531,000 US dollars
Other income (expense), net (calculated)
negative 41,244,000 US dollars
Income before income taxes
156,287,000 US dollars
Provision for income taxes
32,949,000 US dollars
Net income
123,338,000 US dollars
Blue Planet Automation Software and Services - Products and services at a point in time
49,401,000 US dollars
Blue Planet Automation Software and Services - Products and services transferred over time
66,146,000 US dollars
Global Services - Products and services at a point in time
48,579,000 US dollars
Global Services - Products and services transferred over time
565,174,000 US dollars
Networking Platforms - Products and services at a point in time
3,676,377,000 US dollars
Networking Platforms - Products and services transferred over time
0 US dollars
Platform Software and Services - Products and services at a point in time
103,906,000 US dollars
Platform Software and Services - Products and services transferred over time
259,924,000 US dollars
Research and development
848,329,000 US dollars
Selling and marketing
581,331,000 US dollars
General and administrative
238,707,000 US dollars
Amortization of intangible assets
25,758,000 US dollars
Acquisition and integration costs
1,148,000 US dollars
Significant asset impairments and restructuring costs
112,113,000 US dollars

Chart connections

  • Revenue less cost of revenue equals gross profit; gross profit less operating expenses equals operating income.
  • Operating income plus other income or expense equals income before tax. Income before tax less income tax expense or benefit equals net income.
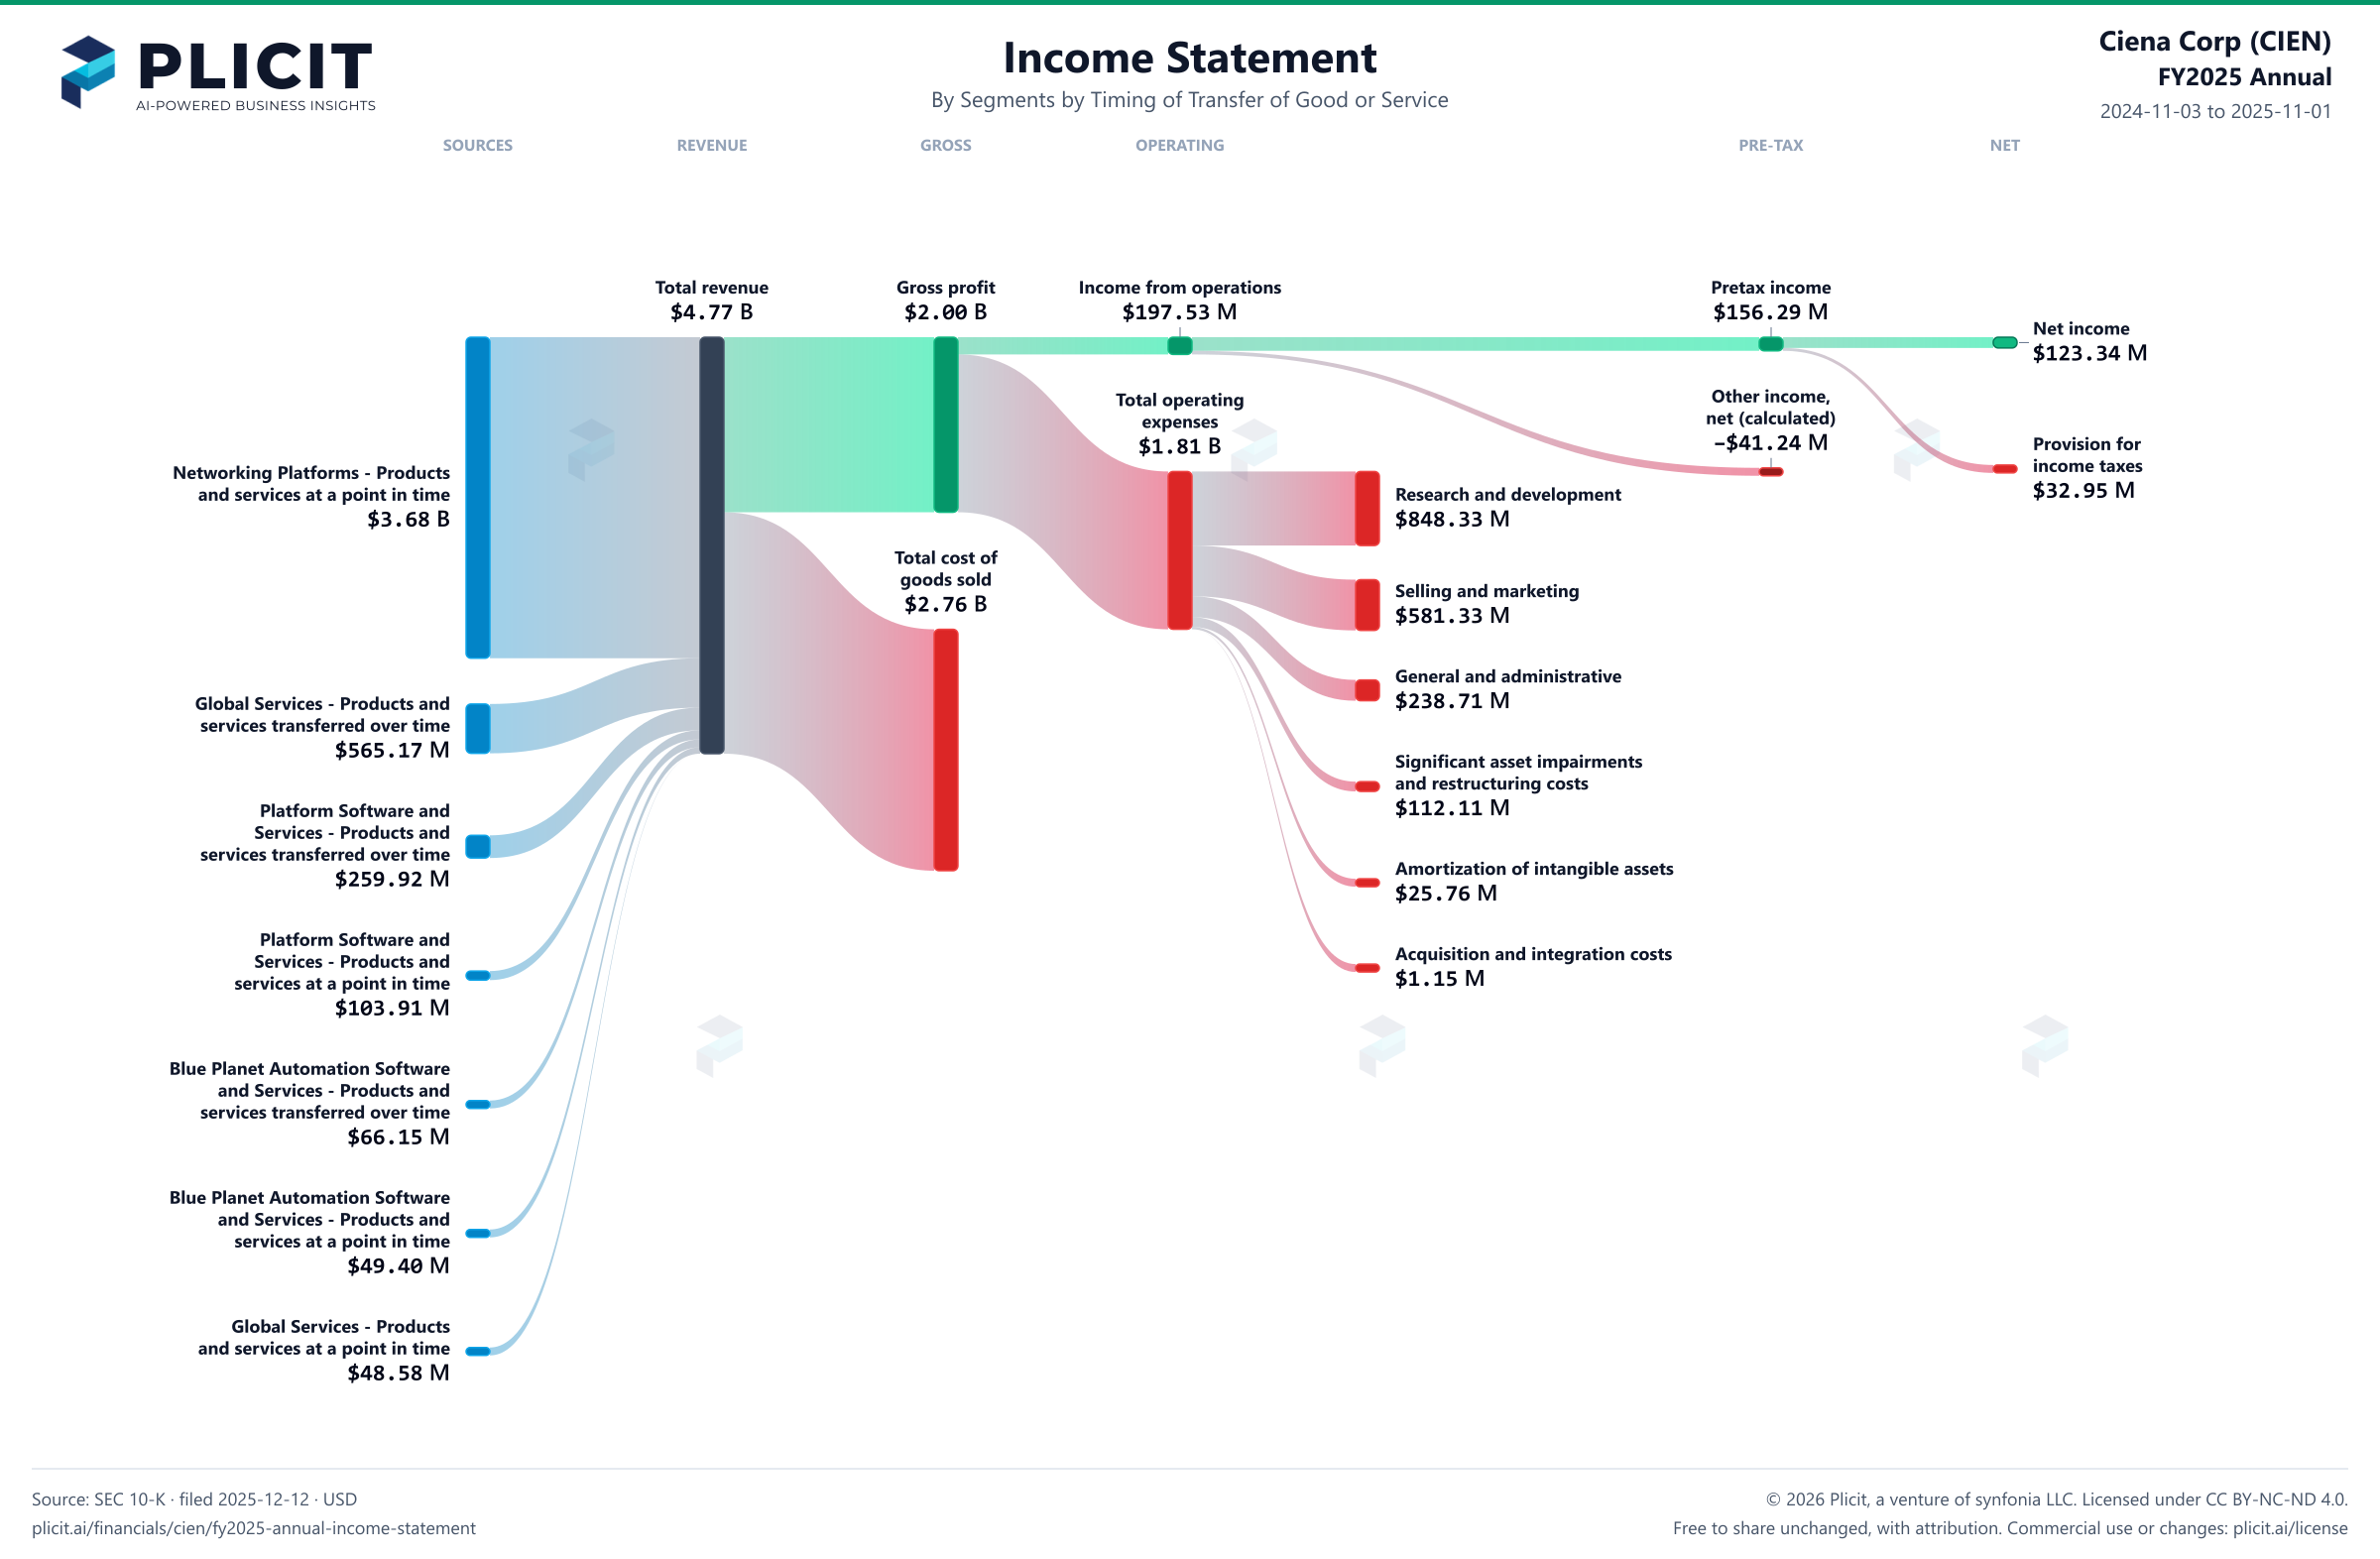
Ciena Corp (CIEN) FY2025 Annual Revenue by Business Segment by Timing of Transfer Sankey chart
Free to share unchanged, with credit to Plicit.ai · CC BY-NC-ND 4.0Download PNG

Gross margin

42.0%

Gross profit / revenue

Operating margin

4.1%

Operating profit / revenue

Cash conversion

653.6%

Operating cash / net income, same period

Newsletter

Get the teardowns by email

Subscribe if you want the public-company teardowns in your inbox when they're released.

Product waitlist

Health Check and Teardown for your own company

A health check uncovers insights of your private books, not a public ticker. Join this list to get notified as soon as we go-live!