
Calumet, Inc. /DE (CLMT) FY2026 Q2 P&L / Income Statement

Revenue by Business Segment by Product and Service

2026-04-01 to 2026-06-30

Swipe to see the full flow
Calumet, Inc. /DE (CLMT) FY2026 Q2 P&L / Income StatementIncome statement for 2026-04-01 through 2026-06-30. View: Segments by Product and Service. Revenue uses this breakdown; costs and expenses retain the consolidated categories.SOURCESREVENUEGROSSOPERATINGPRE-TAXNETSpecialty Products and Solutions - Fuels, asphalt and other by-productsSpecialty Products and Solutions - Lubricating oilsMontana/ Renewables - Renewable fuelsSpecialty Products and Solutions - SolventsMontana/ Renewables - Fuels, asphalt and other by-productsPerformance BrandsSpecialty Products and Solutions - WaxesSalesGross profit (loss)Cost of salesOperating lossOperating costs, including other operating expenses (calculated)General and administrativeSellingOther operating expenseNet loss before income taxesTotal other income (expense)Net lossIncome tax (benefit) expenseNet loss before income taxesNet loss beforeincome taxes−$117.10 MSalesSales$1.45 BGross profit (loss)Gross profit (loss)$18.30 MOperating lossOperating loss−$40.00 MNet lossNet loss−$95.90 MSpecialty Products and Solutions - Fuels, asphalt and other by-productsSpecialty Products and Solutions -Fuels, asphalt and other by-products$537.40 MOperating costs, including other operating expenses (calculated)Operating costs(calculated)$58.30 MCost of salesCost of sales$1.43 BIncome tax (benefit) expenseIncome tax(benefit) expense−$21.20 MGeneral and administrativeGeneral and administrative$39.40 MSpecialty Products and Solutions - Lubricating oilsSpecialty Products andSolutions - Lubricating oils$281.00 MSellingSelling$13.50 MTotal other income (expense)Total other income(expense)−$77.10 MOther operating expenseOther operating expense$5.40 MMontana/ Renewables - Renewable fuelsMontana/ Renewables- Renewable fuels$183.20 MSpecialty Products and Solutions - SolventsSpecialty Products andSolutions - Solvents$153.20 MMontana/ Renewables - Fuels, asphalt and other by-productsMontana/ Renewables - Fuels,asphalt and other by-products$145.80 MPerformance BrandsPerformance Brands$103.60 MSpecialty Products and Solutions - WaxesSpecialty Productsand Solutions - Waxes$40.90 M
Chart details

Calumet, Inc. /DE (CLMT) FY2026 Q2 P&L / Income Statement

Income statement for 2026-04-01 through 2026-06-30. View: Segments by Product and Service. Revenue uses this breakdown; costs and expenses retain the consolidated categories.

Sales
1,445,100,000 US dollars
Cost of sales
1,426,800,000 US dollars
Gross profit (loss)
18,300,000 US dollars
Operating costs, including other operating expenses (calculated)
58,300,000 US dollars
Operating loss
negative 40,000,000 US dollars
Total other income (expense)
negative 77,100,000 US dollars
Net loss before income taxes
negative 117,100,000 US dollars
Income tax (benefit) expense
negative 21,200,000 US dollars
Net loss
negative 95,900,000 US dollars
Performance Brands
103,600,000 US dollars
Montana/ Renewables - Fuels, asphalt and other by-products
145,800,000 US dollars
Montana/ Renewables - Renewable fuels
183,200,000 US dollars
Specialty Products and Solutions - Lubricating oils
281,000,000 US dollars
Specialty Products and Solutions - Fuels, asphalt and other by-products
537,400,000 US dollars
Specialty Products and Solutions - Solvents
153,200,000 US dollars
Specialty Products and Solutions - Waxes
40,900,000 US dollars
General and administrative
39,400,000 US dollars
Selling
13,500,000 US dollars
Other operating expense
5,400,000 US dollars
Gain on sale of business
0 US dollars

Chart connections

  • Revenue less cost of revenue equals gross profit; gross profit less operating expenses equals operating income.
  • Operating income plus other income or expense equals income before tax. Income before tax less income tax expense or benefit equals net income.
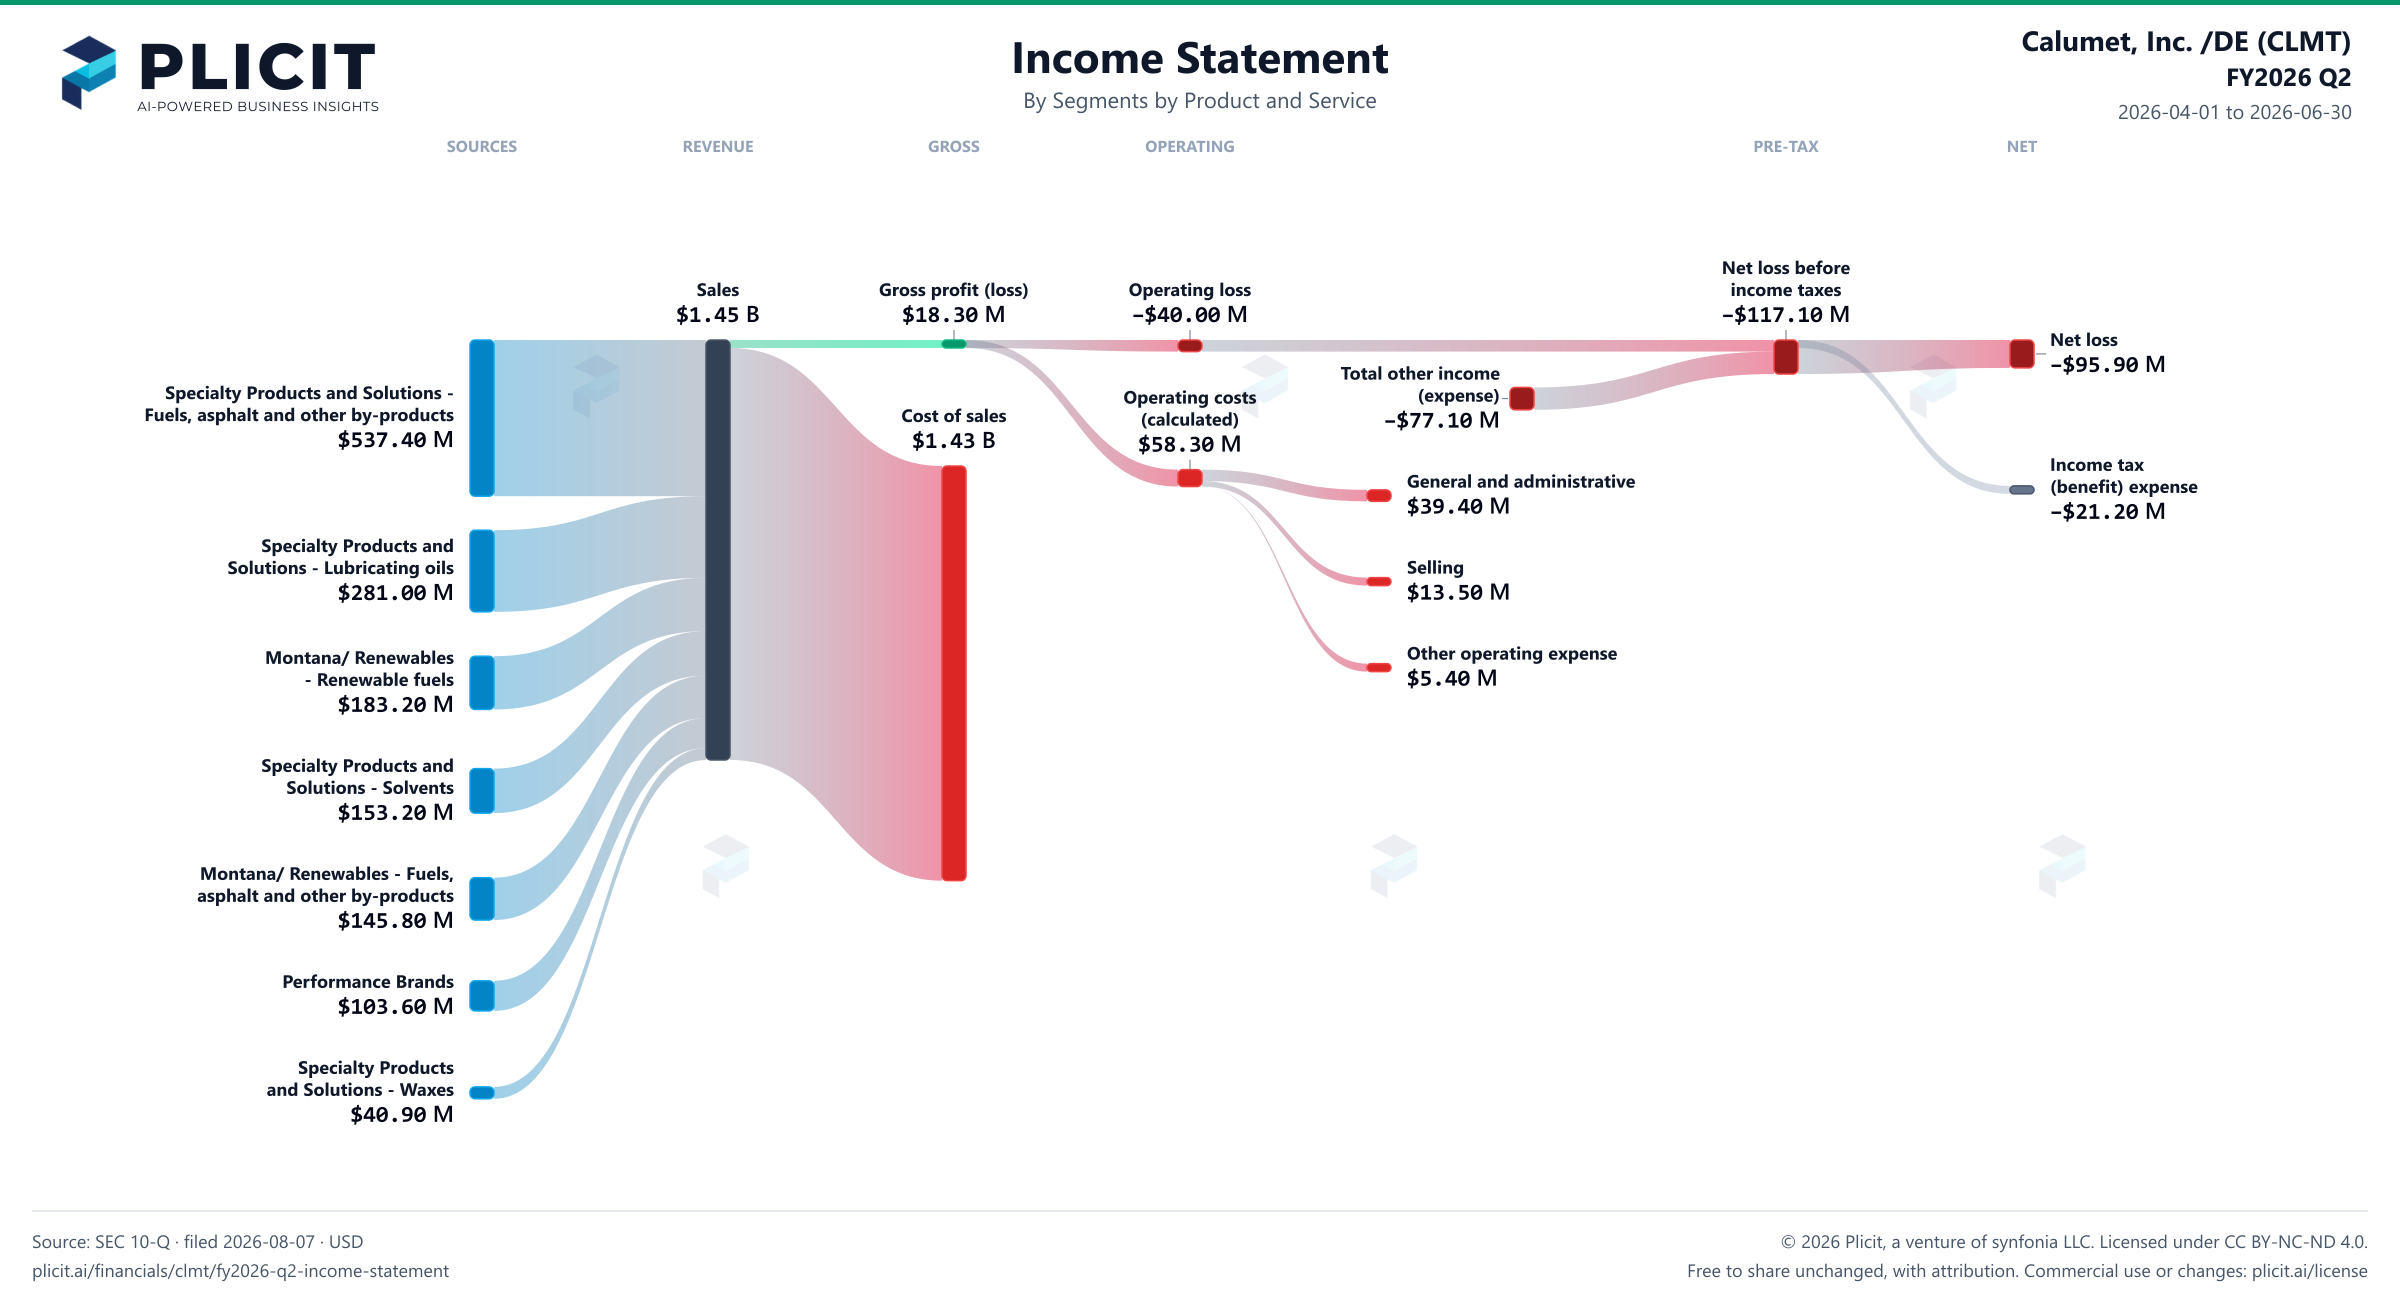
Calumet, Inc. /DE (CLMT) FY2026 Q2 P&L / Income Statement Sankey chart, Segments by Product and Service view
Free to share unchanged, with credit to Plicit.ai · CC BY-NC-ND 4.0Download PNG

Gross margin

1.3%

Gross profit / revenue

Operating margin

−2.8%

Operating profit / revenue

Newsletter

Get the teardowns by email

Subscribe if you want the public-company teardowns in your inbox when they're released.

Product waitlist

Health Check and Teardown for your own company

A health check uncovers insights of your private books, not a public ticker. Join this list to get notified as soon as we go-live!